SSD Price Tracker Guide: Reading the 2026 Storage Market Like a Procurement Buyer
Key takeaways
- Track the gigabyte, not the drive. NVMe Gen4 flash runs a median of $0.200/GB across the 7 SKUs we currently price. A $/GB figure survives a capacity change; a “good price for a 2TB drive” does not.
- The category is not one price. The dearest gigabyte we can currently buy in NVMe Gen4 costs 1.4× the cheapest one — $0.171 against $0.234. Picking the right SKU beats timing the market.
- The same part carries two prices. Samsung 990 Pro 2TB NVMe Gen4 SSD is 2.6% dearer at B&H Photo Video than at Newegg today — $10.00 on one identical SKU.
- Contract prices are a different number. TrendForce put NAND flash contract prices up 10–15% quarter over quarter for Q3 2026 (published 3 July 2026). That is negotiated bulk supply. It is not what a drive costs on a Tuesday, and the gap between the two is where a prepared buyer operates.
- We do not forecast. Every observed figure here renders live from our database; every forecast is attributed to whoever made it, with the date they made it. Those are different categories of claim and we keep them apart.
- What an SSD price tracker owes a buyer
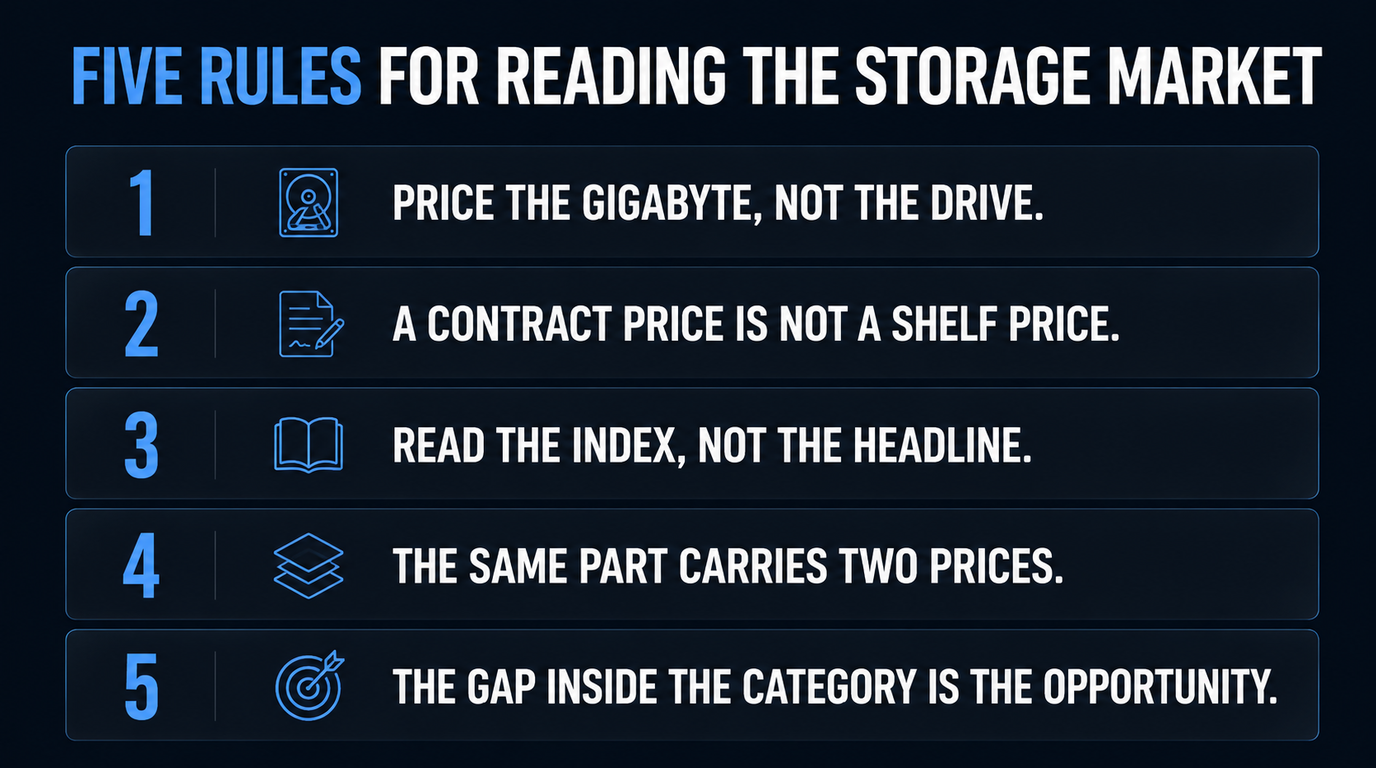
- Rule 1: price the gigabyte, not the drive
- Rule 2: a contract price is not a shelf price
- Rule 3: read the index, not the headline
- Rule 4: the same part carries two prices
- Rule 5: the gap inside the category is the opportunity
- What this tracker will not tell you
- The procurement checklist
- Related reading
- FAQ
You approved a storage budget in the spring and the quotes came back in September looking like a different currency. An SSD price tracker is supposed to stop that happening, and most of them do not, because they answer the wrong question: they tell you what a drive costs today rather than what a gigabyte costs and whether that is unusual. Over 2026 that distinction stopped being academic — TrendForce estimated SLC NAND contract prices rose 130–150% in the first half of the year alone.
This piece is the method we use ourselves, written down. Five rules, each one attached to a live number from our own database rather than a screenshot from March. We scrape real listings at Newegg and B&H, record every observation with a timestamp, and compute a price-per-gigabyte index from them — and where the data is too thin to support a claim, the page below says so instead of rounding up to a story.
None of this requires you to predict anything. That is the point. The rules are about reading a market you cannot control, so that the thirty seconds before you raise a PO are spent on the one decision that is genuinely yours.
What an SSD price tracker owes a buyer
There are a lot of price trackers and most of them are affiliate storefronts wearing a chart for a hat. The tell is what happens when the data runs out. A storefront always has a number for you, because a blank cell does not earn a commission. A tracker that is actually measuring something will occasionally tell you it does not know.
We think the bar is four things, and they are all boring: observations, not estimates — a price we saw on a live product page, timestamped, or nothing; a normalised unit so that drives of different sizes are comparable at all; a stated sample size, so you can tell a median from an anecdote; and a visible refusal when the sample is too thin. Our floor is 5 SKUs. Under it we name the category as withheld rather than quietly dropping it, because a silent omission and a published weak median look identical to a reader and are both worse than saying nothing.
Everything below follows from those four. If you take one thing from this guide, take the habit of asking any price source how many observations are behind its number and what it does when it has none. You can see our current answer on the live SSD price chart, which carries the same sample counts this article does.
Rule 1: price the gigabyte, not the drive
A gigabyte is a gigabyte. A drive is a bundle of gigabytes, a controller, a warranty and a brand, and comparing two bundles of different sizes tells you almost nothing about whether either is good value. The conversion is one division and it reorders your shortlist more often than you would expect.
| Category | Median $/GB | Cheapest | Dearest | SKUs |
|---|---|---|---|---|
| DDR5 memory | $17.47 | $14.37 | $20.31 | 7 |
| NVMe Gen4 SSD | $0.200 | $0.171 | $0.234 | 7 |
Withheld: DDR4 memory (4 SKUs) — below our 5-SKU floor. A median of three listings is not a median.
Read that table across rather than down. The median column is what a normal gigabyte costs in each category right now. The cheapest and dearest columns are the ones that matter for a purchase: they describe how wide the category is, and therefore how much of your outcome is determined by which SKU you pick rather than which week you buy in.
The habit to build: whenever a vendor quotes you a drive price, convert it before you respond. If the number lands above the dearest column above, you are not being offered a deal, whatever the discount badge says.
Rule 2: a contract price is not a shelf price
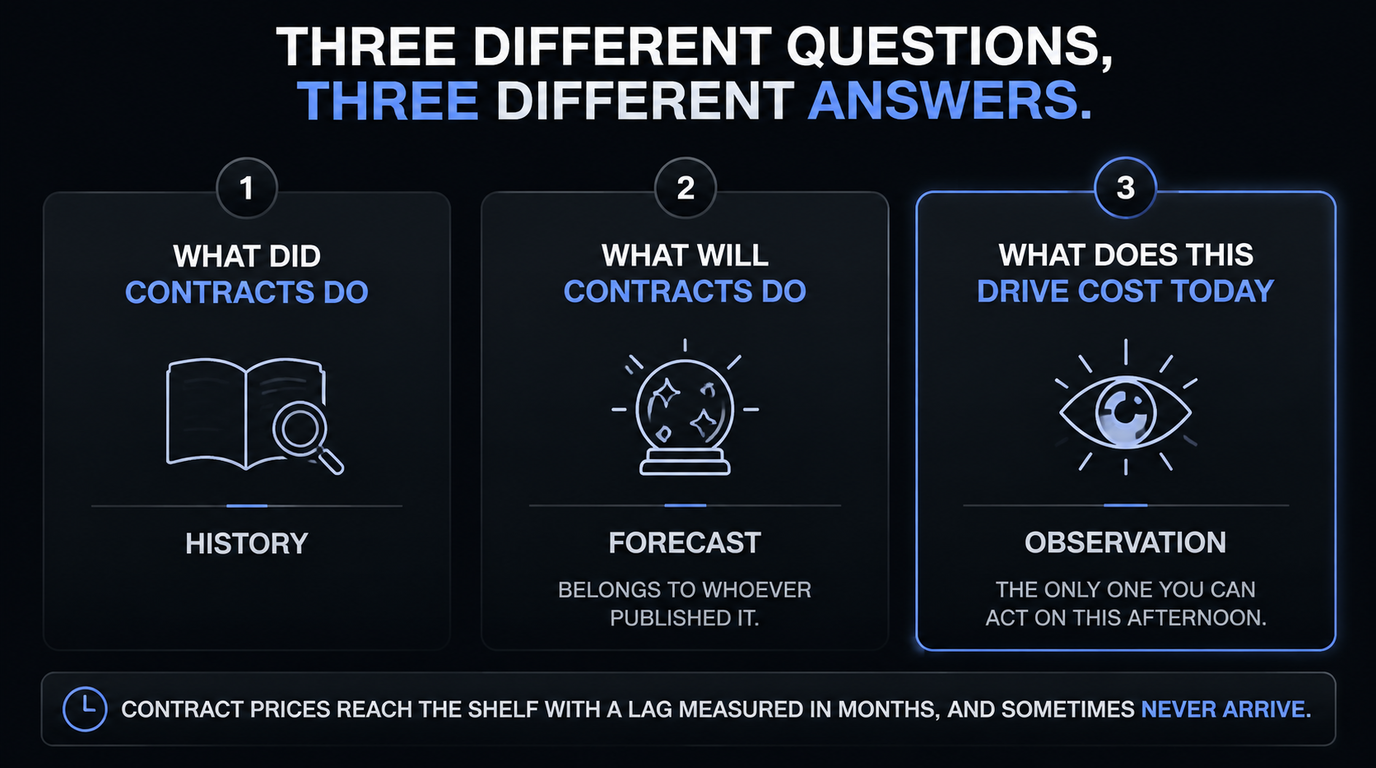
Almost every memory-market headline you will read this year is quoting a contract price: the negotiated rate between a supplier and a large buyer, settled quarterly, in volumes you and I do not transact. Those numbers are real and they matter, but they are upstream of the shelf by a lag that is measured in months, and sometimes they never arrive at all.
| Segment | Period | Move | Published |
|---|---|---|---|
| NAND flash contract | Q3 2026 (forecast) | +10–15% QoQ | TrendForce, 3 Jul 2026 |
| Conventional DRAM contract | Q3 2026 (forecast) | +13–18% QoQ | TrendForce, 3 Jul 2026 |
| Enterprise SSD contract | Full-year 2026 (est.) | ≈ +235% | TrendForce, 25 Aug 2026 |
| Server DRAM contract | Full-year 2026 (est.) | ≈ +270% | TrendForce, 25 Aug 2026 |
| SLC NAND contract | 1H 2026 (est. actual) | +130–150% | TrendForce, 16 Jun 2026 |
| NOR flash contract | 1H 2026 (est. actual) | +100–120% | TrendForce, 16 Jun 2026 |
Look at the spread of periods in that table and you can see why a single headline misleads. TrendForce’s 16 June 2026 note described first-half moves that had already happened. Its 3 July 2026 forecast put NAND flash at +10–15% QoQ for Q3 — a deceleration, explicitly attributed to consumer buyers reaching an affordability limit and a high comparison base. And its 25 August 2026 analysis estimated enterprise SSD contract prices up roughly 235% across 2026, with memory rising from 47% of major cloud providers’ capital expenditure in 2026 to a projected 68% in 2027.
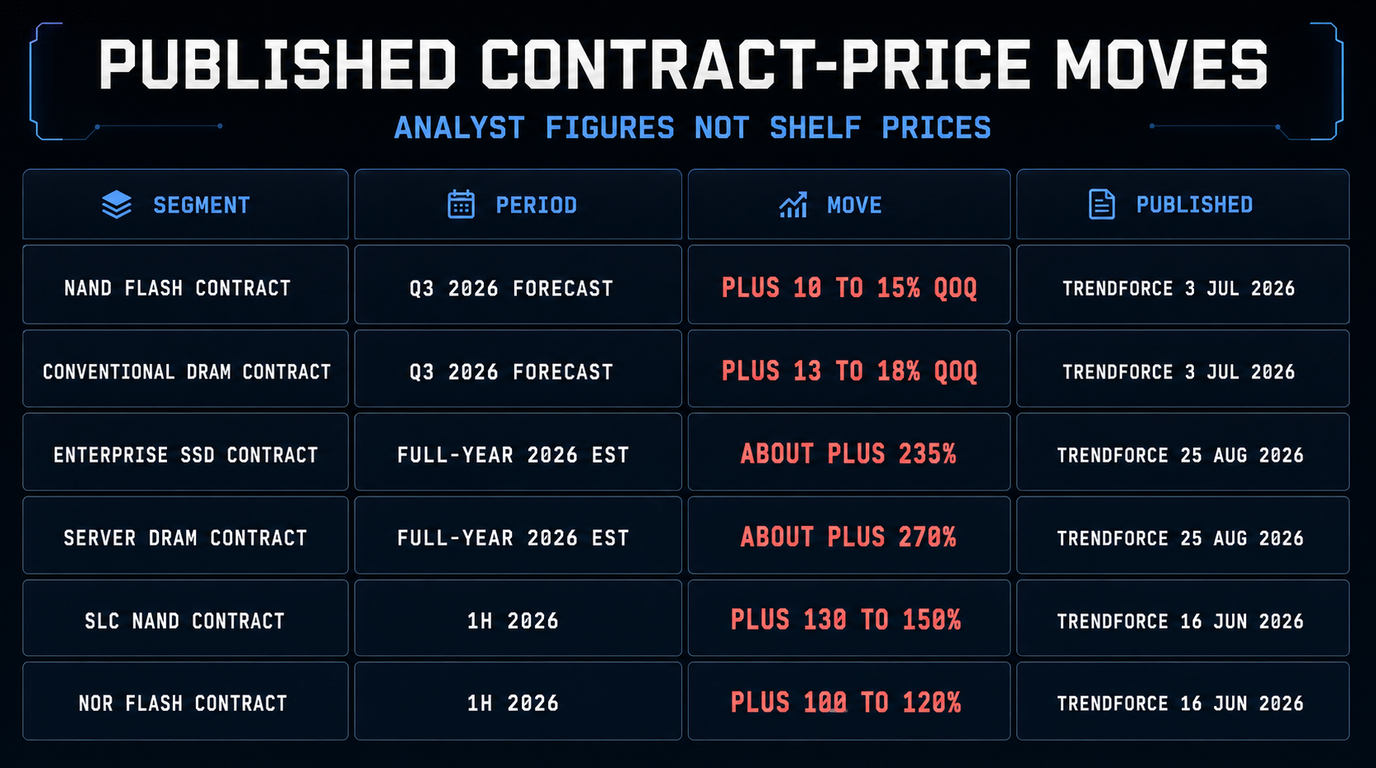
The practical use of the contract table is not prediction, it is direction. It tells you which way the pressure points, so that a shelf price which has not moved yet reads as a window rather than a trend.

Rule 3: read the index, not the headline
An index answers the only question a single price cannot: is this normal? We normalise each category to a base of 100 at the start of its series, so a move is legible without you holding last month’s prices in your head. Here is where each category sits against its own starting point:
Note that these two do not move together. Over the same window our SSD index moved -0.5% while DDR5 moved +7.5%. That is the single most useful thing an index does for a buyer: it stops you reading a memory headline across to a storage budget. NAND and DRAM are separate supply chains, and the HBM reallocation that squeezed DDR5 has no direct equivalent on the flash side — we went through that mechanism in detail in why RAM prices are so high.
You can see the per-drive series behind the index on the SSD price chart, and its memory counterpart on the RAM price chart. The index is the summary; the per-SKU series is where you check whether the summary is being carried by one weird listing.
Rule 4: the same part carries two prices
This is the finding with the most immediate cash value and it is the one no market report will ever give you, because it only exists if somebody checks two shops on the same day. When we hold an in-stock price for the same SKU at more than one retailer, the two prices are frequently not close:
Identical part number, same day, $10.00 apart. There is no mystery in it: in a fast-moving market each retailer reprices its own inventory on its own clock, and for stretches of days they simply disagree about what a drive is worth. The spread is not a discount anybody is offering you. It is a desynchronisation you can walk through. Multiply it by an order quantity and the case for opening a second tab makes itself.
One honest caveat about the block above: it ranks across everything we track, memory and storage alike, because the mechanism is identical in both. If the top entry is a DIMM rather than a drive, that is the market being interesting, not the table being off-topic. Every SKU we price is listed on the tracked products page with its own history.
Rule 5: the gap inside the category is the opportunity
Buyers spend most of their attention on timing — buy now, wait a month — and almost none on dispersion, which is the gap between the cheapest and dearest gigabyte available inside a single category on a single day. Dispersion is the part you control.
Sit with that for a second. Choosing well within the category is worth more than a quarter of market movement in either direction, and it is available to you today, with no forecast required and no risk that you called the cycle wrong. Timing is a bet. Dispersion is arithmetic.
The caveat that keeps this honest: cheap gigabytes are not always the right gigabytes. A QLC drive with a small SLC cache will post a lovely $/GB and then fall over during a sustained write, and an enterprise workload with real endurance requirements has no business shopping on price per gigabyte alone. Use dispersion to build the shortlist, then let the specification cut it down — in that order, not the reverse.
What this tracker will not tell you
A guide that only lists a tool’s strengths is a brochure. Here is where ours stops, stated plainly, because knowing the edges is what makes the middle usable.
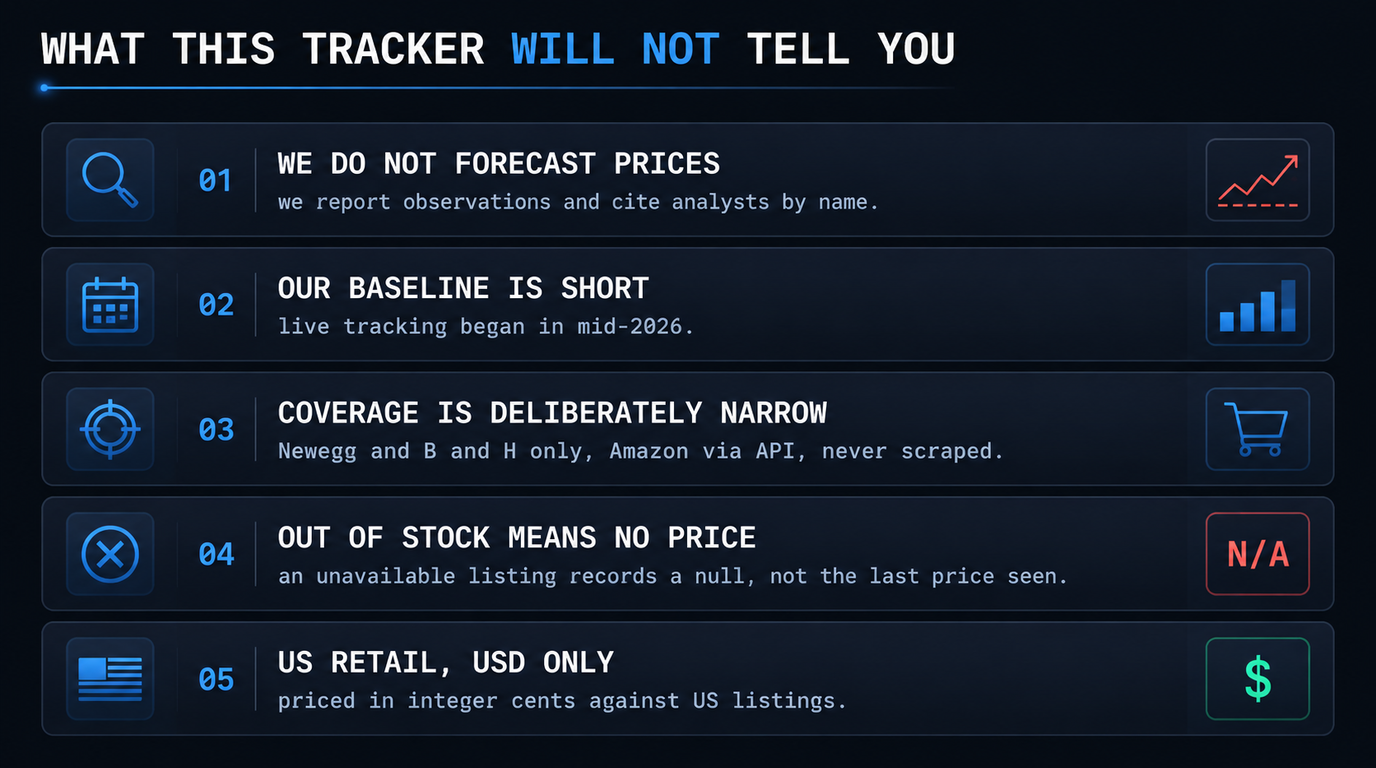
- We do not forecast prices. Not next month, not Black Friday. We report observations and cite analysts by name when they make a call, and we will not blur the line between the two to make a headline.
- Our baseline is short. Live tracking began in mid-2026. Three honest weeks beat a year of backfilled guesses, but three weeks is three weeks and every index block on this site prints its own point count so you can judge it.
- Coverage is deliberately narrow. We scrape Newegg and B&H, both of which permit it in robots.txt — we check before a retailer’s first scrape and record the check. Amazon is reached only through the Keepa API and never scraped. Micro Center blocks robots.txt inspection outright, so we dropped it rather than work around it. That costs us coverage and we would rather pay it.
- Out of stock means no price. An unavailable listing records a null, not the last price we saw. Carrying a number forward would be inventing an observation that never happened, and it is the most common way price history charts quietly lie.
- US retail, USD only. Everything here is priced in integer cents against US listings. If you are buying in another region, the direction may travel but the level will not.
None of that is an apology. A tracker that claims none of these limits is not more capable; it is just less forthcoming about the same ones.
The procurement checklist
Five rules, compressed into what you actually do the week a storage order goes out.
- Convert every quote to $/GB before you reply. One division. Compare against the median column above, not against last quarter’s invoice.
- Shortlist on dispersion, cut on specification. Find the cheap gigabytes first, then eliminate on endurance, sustained write and warranty. Doing it the other way round anchors you to a brand before you know what it costs.
- Price the same SKU at two retailers, every time. Thirty seconds, and the spread block above is what it is worth on a bad day.
- Re-quote at the end of the approval cycle. A quote from three weeks ago is a historical document. Put the price check immediately before the PO, not at the start of the paperwork.
- Budget storage and memory separately. Our two indexes have not been moving together. Treating one as a proxy for the other is how a budget line gets set from the wrong market.
- Set a threshold instead of watching. Decide the $/GB you would buy at, then have something tell you when a tracked SKU crosses it. Staring at a chart daily is how buyers end up timing badly and calling it discipline.
Related reading
FAQ
What is the best way to track SSD prices?
Track price per gigabyte rather than price per drive, against a stated sample of SKUs, and set a threshold you would buy at instead of checking daily. A per-drive price cannot be compared across capacities, and a tracker that never shows you its sample size cannot be distinguished from a storefront. Our SSD chart publishes the SKU count behind every median and withholds a category entirely when it falls below five SKUs.
How much does an SSD cost per gigabyte right now?
Across the 7 NVMe Gen4 SKUs we currently hold in-stock prices for, the median is $0.200 per gigabyte, with the cheapest at $0.171 and the dearest at $0.234. Those figures render from observed retailer listings each time the page rebuilds, so they reflect our most recent scrape rather than the day this article was written.
Why are SSD prices rising in 2026?
The pressure is upstream, in NAND flash supply, and it is well documented by analysts rather than by us. TrendForce estimated SLC NAND contract prices rose 130–150% during the first half of 2026 (published 16 June 2026) and forecast NAND flash contract prices rising a further 10–15% quarter over quarter in Q3 2026 (published 3 July 2026), attributing the slower pace to consumer buyers reaching an affordability limit. We report what those contract moves do to shelf prices only once we observe it.
Are contract prices the same as the price I pay?
No, and conflating them is the most common mistake in memory-market coverage. Contract prices are negotiated quarterly between suppliers and large buyers in volumes retail does not transact. A retailer is selling inventory it already owns, bought at an older price, so upstream increases reach the shelf on a lag when that inventory turns over — unevenly, and sometimes not at all.
Do SSD and RAM prices move together?
Not in our data. Over the window we cover, our SSD index moved -0.5% while our DDR5 index moved +7.5%. NAND and DRAM are separate supply chains: high-bandwidth memory for AI accelerators competes with DRAM for the same wafers, and does not compete with NAND. Budget the two categories separately.
Does it matter which retailer I buy an SSD from?
More than most buyers assume. We observed the same Samsung 990 Pro 2TB NVMe Gen4 SSD at $379.99 from Newegg and $389.99 from B&H Photo Video on the same day — 2.6% apart on an identical part. Retailers reprice their own inventory on their own schedules, and in a fast-moving market they drift apart for days at a time.
Should I buy a bigger SSD to get a better price per gigabyte?
Often, but check rather than assume — larger capacities usually price better per gigabyte, and the gap between the cheapest and dearest gigabyte we can currently buy in NVMe Gen4 is 1.4×. That dispersion is worth more than most of the market movement people try to time. Then apply the specification: a drive with a small SLC cache posts an attractive $/GB and slows sharply during sustained writes.
When will SSD prices come down in 2026?
We do not forecast, and we would rather say so plainly than guess with a straight face. What we can tell you is what we observe and what analysts have published: TrendForce noted in its 3 July 2026 outlook that NAND flash contract increases were moderating to 10–15% quarter over quarter as consumer demand weakened, and in its 25 August 2026 analysis projected memory rising to 68% of major cloud providers’ capital expenditure in 2027. Those are their calls, with their dates on them. Our own prices come from live Newegg and B&H product pages, timestamped, with out-of-stock listings recording no price rather than repeating the last one we saw.
Set the number once, and stop watching the chart
We watch 18+ tracked SKUs across Newegg and B&H and tell you when one of yours crosses your threshold. No deal scores, no affiliate links, no commission on anything you buy — observed prices and what they mean.