SSD Prices in 2026: What the Shelf Actually Did, and What to Pay Now
Key takeaways
- A gigabyte of NVMe Gen4 currently costs $0.200 at the median of what we track. The spread across the SKUs we hold runs from $0.171 to $0.234, so the drive you pick matters roughly as much as the week you buy it.
- The storage side and the memory side are not moving together. Over the windows we hold, our SSD index moved −0.5% while the DDR5 index moved +7.5% — 8.0 percentage points apart on identical methodology.
- Contract prices and shelf prices are two numbers. TrendForce put NAND Flash contract prices up 10–15% quarter over quarter for 3Q26. That describes pressure building upstream. It does not tell you what a drive costs on a Tuesday, and our observations are the Tuesday.
- Most of the increase you have read about predates anything we can measure. Our tracking starts on 22 June 2026, after the largest step-up had already happened at retail. We say so rather than presenting a short flat series as proof that nothing changed.
- Out of stock is the other price signal. An unavailable listing records no price here rather than carrying the last one forward, so a drive quietly dropping out of our table is information in its own right.
- What a gigabyte of NVMe costs right now
- How far storage moved in the window we can see
- Contract prices and shelf prices are different numbers
- Why memory kept climbing and storage did not
- The increase you are reading about mostly already happened
- What to pay, by capacity
- Out of stock is the other price signal
- Buy now or wait, without a forecast
- How these numbers are produced
- Related reading
- FAQ
Every page you can find about SSD prices in 2026 is a forecast, and the forecasts disagree by a factor of ten. That is an expensive kind of confusion: a 2 TB NVMe drive that used to be an impulse purchase is now a line item somebody has to approve, and “prices have doubled” is not enough information to approve or refuse it. This page answers the narrower question instead — what a gigabyte of NVMe actually costs at a US retailer today, and how far it has moved since we started watching.
We can answer it because we are not summarising anybody. We scrape live product pages at Newegg and B&H, record every observation with a timestamp, and compute the median price per gigabyte from those records. Every figure in the tables below rendered from that database when this page was built, alongside the number of SKUs behind it. Where a category is too thin to carry a median, you will see it named as withheld rather than quietly dropped.
What follows is the observed price level, the measured move, the gap between the contract market and the shelf, and a per-capacity budget you can take to a purchase order. There is no prediction anywhere in it. We do not forecast prices, and after reading a dozen pages that do, you may find that a relief rather than a limitation.
What a gigabyte of NVMe costs right now
Drive prices are quoted per drive, which is the one unit that makes comparison impossible. A $350 2 TB drive and a $790 4 TB drive are not two and a bit apart; per gigabyte they are close to level. Divide by capacity and the market becomes legible in about four seconds, which is why every table on this site is denominated that way.
| Category | Median $/GB | Cheapest | Dearest | SKUs |
|---|---|---|---|---|
| DDR5 memory | $17.47 | $14.37 | $20.31 | 7 |
| DDR4 memory | withheld | $7.50 | $9.37 | 4 — below floor |
| NVMe Gen4 SSD | $0.200 | $0.171 | $0.234 | 7 |
The median is the number to carry around: $0.200 per gigabyte across 7 NVMe Gen4 SKUs. The dispersion matters as much as the middle, though. At $0.171 to $0.234, the dearest drive we track costs meaningfully more per gigabyte than the cheapest for storage that is, for most workloads, interchangeable.
That dispersion is the first practical finding of the year: brand premium has not disappeared in the shortage. If you are buying capacity rather than a specific controller, the cheapest column is the one to shop from. The SSD price chart lists every drive we hold with the date its price was observed.
How far storage moved in the window we can see
A price level tells you what to pay. It does not tell you whether to hurry. For that we run an index: per SKU the lowest in-stock price across retailers, divided by capacity, the median taken across SKUs, normalised to 100 at the start of the series. One strange listing cannot drag it, and it is computed identically for memory and for storage.
| Index | Start | Latest | Change | Window | Points |
|---|---|---|---|---|---|
| DDR5 memory | 110.6 | 118.9 | +7.5% | Aug 1, 2026 – Aug 13, 2026 | 4 |
| SSD | 101.8 | 101.3 | −0.5% | Aug 1, 2026 – Sep 21, 2026 | 17 |
Read the point count before the percentage. Our storage series moved −0.5% between Aug 1, 2026 and Sep 21, 2026, across 17 index points. That is a real measurement of a short window, not a trend line, and we would rather you saw the window than took the number on faith.
Contract prices and shelf prices are different numbers
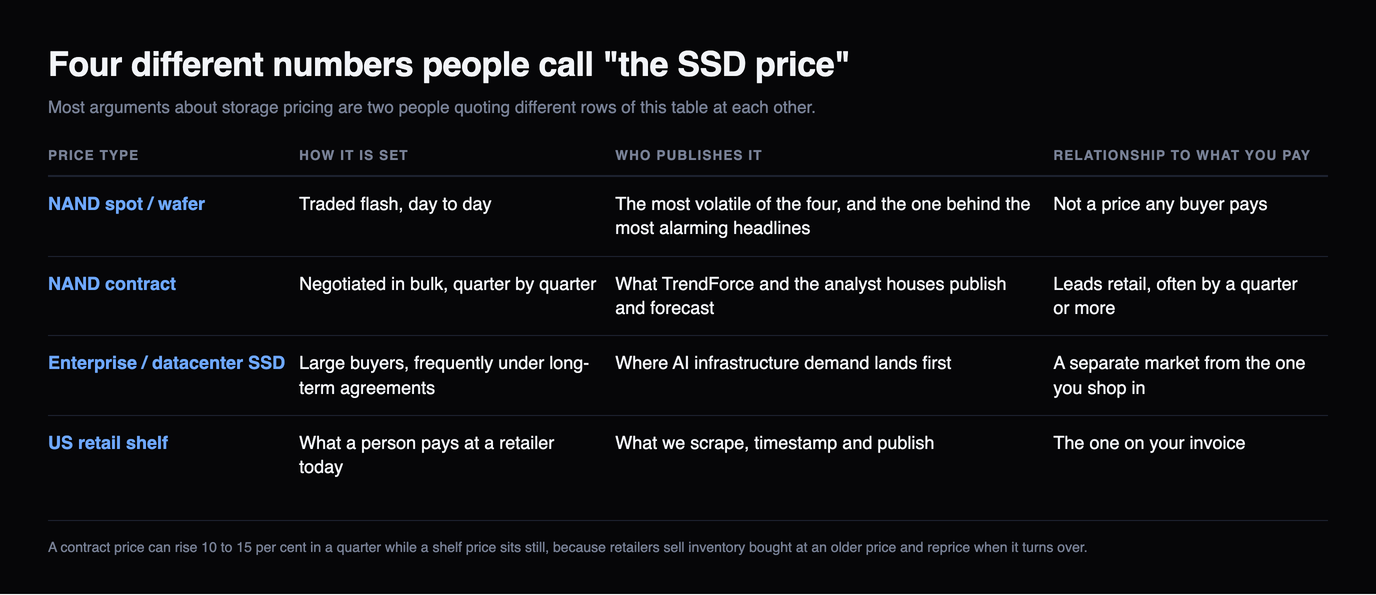
Almost every alarming SSD number in circulation this year is a contract or spot price. Those are negotiated in bulk, quarter by quarter, between manufacturers and large buyers. The number on a Newegg product page is a retailer selling inventory it already owns, bought at an older price, and it moves when that inventory turns over.

| Price type | Who sets it | What it is good for | How it relates to your invoice |
|---|---|---|---|
| NAND spot / wafer | Traded flash, day to day | The most volatile of the four, and the one behind the most alarming headlines | Not a price any buyer pays |
| NAND contract | Negotiated in bulk, quarter by quarter | What TrendForce and the analyst houses publish and forecast | Leads retail, often by a quarter or more |
| Enterprise / datacenter SSD | Large buyers, frequently under long-term agreements | Where AI infrastructure demand lands first | A separate market from the one you shop in |
| US retail shelf | What a person pays at a retailer today | What we scrape, timestamp and publish | Moves when the inventory a retailer already owns turns over |
Sorting the numbers by which market they describe does most of the work. Once you know that a doubling refers to contract flash rather than a shelf price, the headline stops being a reason to panic-buy and becomes what it is: a signal about pressure that may or may not reach the listing you are watching, on a schedule nobody has published.
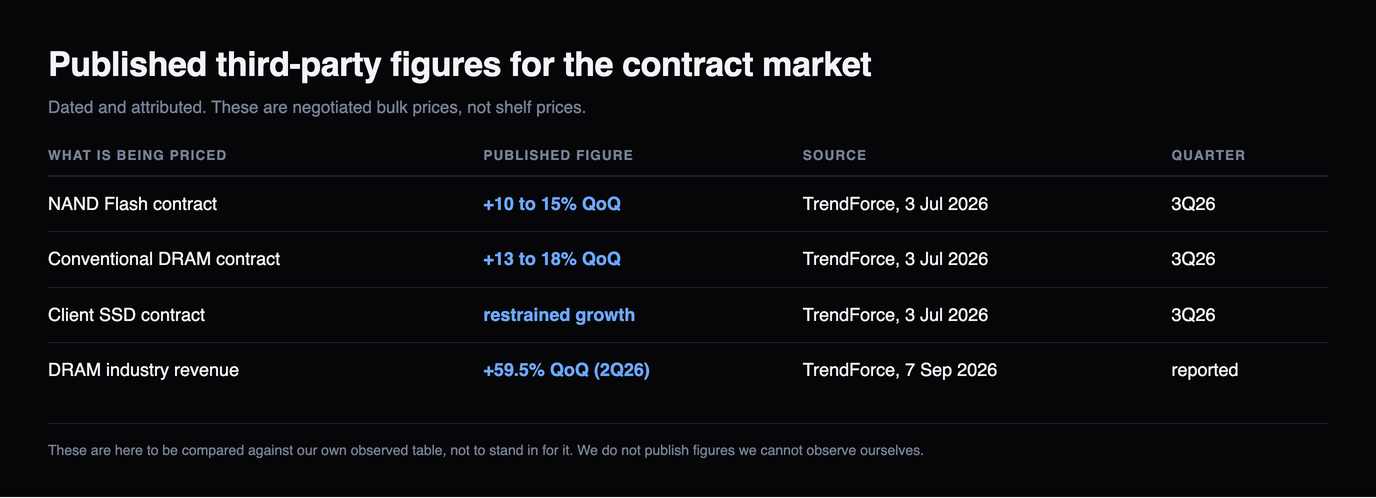
| What is being priced | Published figure | Source | Quarter |
|---|---|---|---|
| NAND Flash contract | +10–15% QoQ | TrendForce, 3 Jul 2026 | 3Q26 |
| Conventional DRAM contract | +13–18% QoQ | TrendForce, 3 Jul 2026 | 3Q26 |
| Client SSD contract | restrained growth | TrendForce, 3 Jul 2026 | 3Q26 |
| DRAM industry revenue | +59.5% QoQ (2Q26) | TrendForce, 7 Sep 2026 | reported |
The lag between those two columns is not a rounding error, it is the entire reason a shelf price can sit still through a quarter that TrendForce describes as up 10–15%. It is also the window a prepared buyer gets to use. Worth noting from the same 3 July release: TrendForce expected client SSD contract growth to be the restrained one, because PC makers were sitting on inventory and had lost their appetite for another increase.
The trade press has covered the upstream story thoroughly — Tom’s Hardware reported Phison’s chief executive confirming NAND prices have more than doubled with 2026 production sold out, and TechRadar has declared the days of cheap 1 TB SSDs over. Neither claim is in dispute here. The question this page answers is the one those articles do not: what the retail figure is today, and by how much it has moved since June.
Why memory kept climbing and storage did not
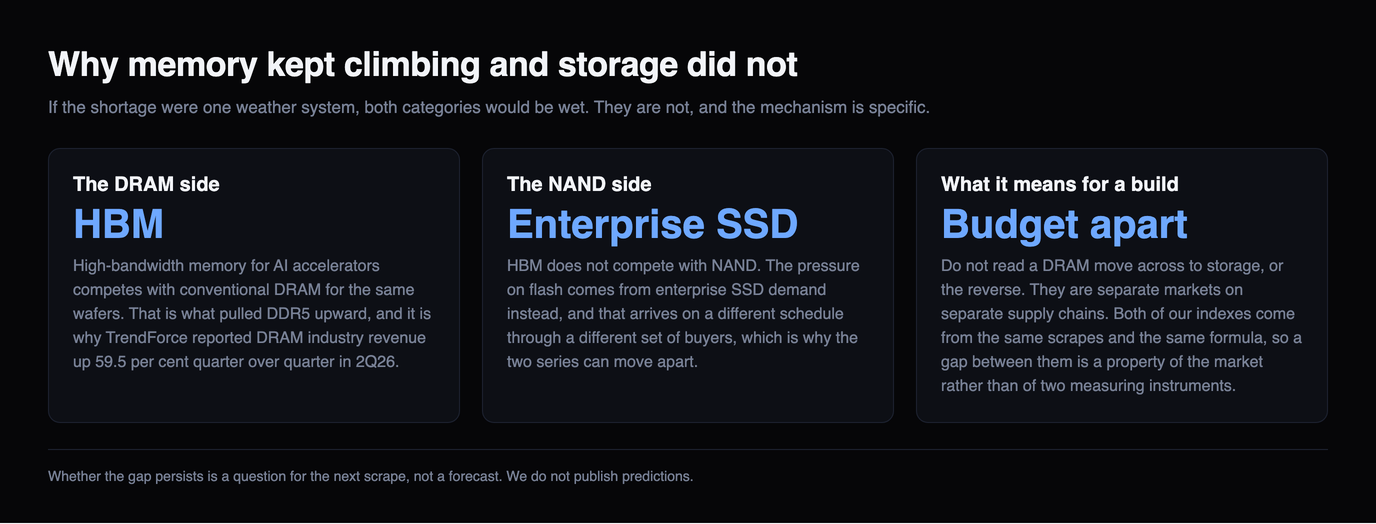
If the shortage were one weather system, both categories would be wet. They are not, and the mechanism is specific. High-bandwidth memory for AI accelerators competes with conventional DRAM for the same wafers, which is what pulled DDR5 upward. HBM does not compete with NAND. The pressure on flash comes from enterprise SSD demand instead, and that arrives on a different schedule through a different set of buyers.
The level gap is larger than most builders expect. A gigabyte of DDR5 currently costs about 87 times a gigabyte of NVMe storage at our observed medians — $17.47 against $0.200. In a constrained budget, that ratio is usually the argument for buying the storage you want now and the memory you need rather than the memory you fancy.
The memory side of this is covered in detail in why RAM prices are so high, and the per-gigabyte comparison between the two DDR generations is in DDR4 vs DDR5 prices.
The increase you are reading about mostly already happened
Here is the caveat that most of our competitors would leave out, and it cuts against the flattering reading of our own data. Our series begins on 22 June 2026. The dramatic retail repricing that made SSD prices a news story — the drives that went from roughly a hundred dollars to several hundred — largely happened before that date. A flat index since June is not evidence that nothing changed. It is evidence that the shelf has been quiet since we started watching it.
You can see the same thing in the level rather than the change. The absolute figures in the first table are historically high for consumer NVMe. The market did not stay cheap and then fail to move; it repriced, and then it settled at the new level while our index recorded the settled part. Anyone telling you our data disproves the shortage is misreading it, and so would we be if we let you.
What to pay, by capacity
The most useful thing a price tracker can hand a buyer is a number to put in a budget. Take the observed per-gigabyte figures and multiply them out, and you get the range a given capacity should land in before you go shopping.
| Capacity | At the observed median | At the cheapest $/GB we hold |
|---|---|---|
| 1 TB | $200 | $171 |
| 2 TB | $401 | $342 |
| 4 TB | $801 | $683 |
| 8 TB | $1,602 | $1,367 |
Use the right-hand column as the target and the middle column as the number you will probably pay. If a quote comes in meaningfully above the median column for the same capacity, you are paying a brand premium or a retailer premium, and both are negotiable in a way the market price is not. If it comes in under the cheapest column, check the listing is the capacity and generation you think it is before celebrating.
One structural note on capacity: the per-gigabyte curve does not always reward buying bigger in a shortage. On our current observations the cheapest gigabyte is not reliably on the largest drive, so the usual “buy the 4 TB, it is cheaper per gigabyte” rule deserves a ten-second check against the per-drive table rather than assuming. We have not held a long enough series to say which capacities repriced hardest, and we are not going to guess at it.
Out of stock is the other price signal
When a listing goes out of stock, we record no price rather than carrying the last one forward. Carrying it forward would be inventing an observation that never happened, and it is the single most common way a price chart quietly becomes fiction. The consequence is that a drive can disappear from our best-price table without its price having changed at all.
Treat that as information. In a supply-constrained market, availability usually moves before price does: the cheap listing sells out, the expensive one remains, and the effective price a buyer faces rises before any number on any page changes. A tracker that interpolates through the gap will show you a flat line through exactly the period you most needed to see.
Buy now or wait, without a forecast
We are not going to tell you where storage prices land in December. Nobody knows, and the confident pages that do tell you are guessing with a straight face. What the data supports is narrower and more useful, and it takes the form of decision rules rather than a prediction.
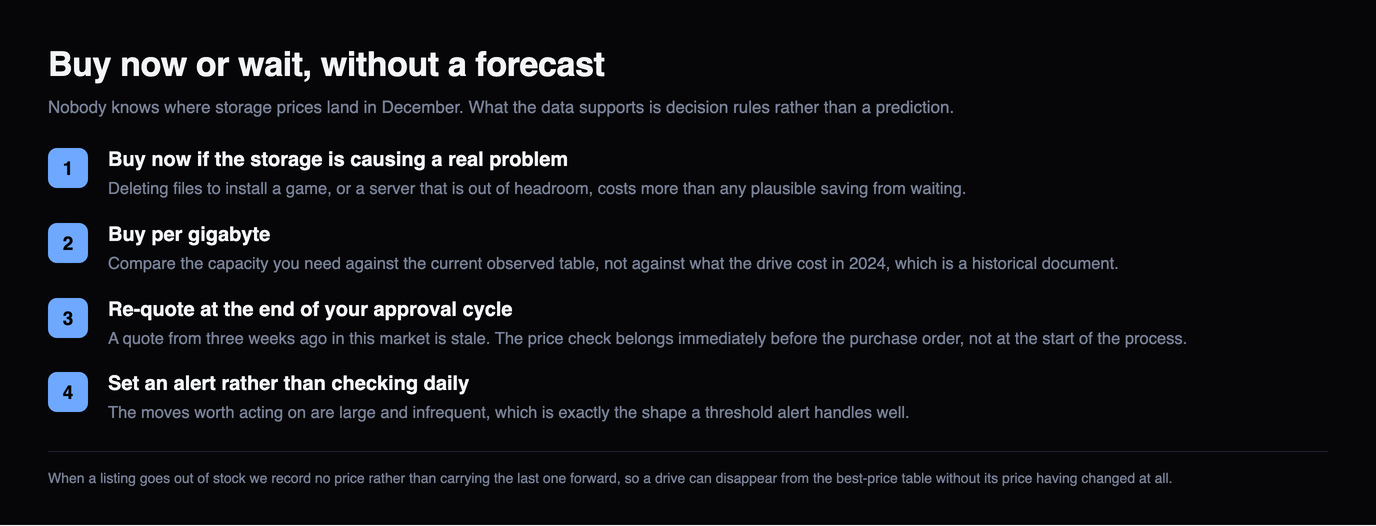
Buy now if the storage is causing a real problem. Deleting files to install a game, or a server that is out of headroom, costs more than any plausible saving from waiting. Buy per gigabyte. Compare the capacity you need against the table above, not against what the drive cost in 2024, which is a historical document. Re-quote at the end of your approval cycle. A quote from three weeks ago in this market is stale, and the price check belongs immediately before the purchase order, not at the start of the process.
Set an alert rather than checking daily. The moves worth acting on in this market are large and infrequent, which is exactly the shape a threshold alert handles well — our guide to setting a price alert threshold explains what number actually fires and why anything under the detection floor never will.
How these numbers are produced
Real listings only. Prices come from live product pages at Newegg and B&H, both of which permit it in robots.txt — we check and record that before a retailer’s first scrape. Amazon is Keepa-API-only and never scraped. Micro Center blocks robots.txt inspection, so we dropped it rather than work around it.
Nothing is invented. Demo and seed rows are flagged in the database and blocked from public pages at the database layer rather than by convention, so an article here physically cannot quote a fabricated price. Out-of-stock listings record a null price. Thin categories are withheld below 5 SKUs and named as withheld. Every figure above carries the date it was computed, and the full method is set out in the SSD price tracker guide.
Related reading
FAQ
How much should an SSD cost in 2026?
Price it per gigabyte rather than per drive. Across the NVMe Gen4 SKUs we track, observed prices run from $0.171 to $0.234 per gigabyte, with a median of $0.200 across 7 SKUs. Multiply that by the capacity you want and you have the range a quote should land in. Every figure is an observation from a live Newegg or B&H product page, with the date it was recorded printed beside it on our SSD price chart.
Are SSD prices still going up in 2026?
At the contract level, yes: TrendForce projected NAND Flash contract prices up 10-15% quarter over quarter for 3Q26 in its 3 July 2026 release. At US retail, our own SSD index moved −0.5% between Aug 1, 2026 and Sep 21, 2026 across 17 index points. Those two numbers are not in conflict — contract prices are negotiated in bulk and retail prices move when a retailer's existing inventory turns over.
Why do SSD price articles disagree with each other so much?
Because they are usually pricing different things and rarely say which. A contract price, a spot NAND wafer price, an enterprise drive price and a US retail shelf price all move differently and on different schedules. A page that quotes a doubling without naming which market it means is not wrong so much as unusable. We publish only what we observe at retail, and label the third-party contract figures as contract figures.
Should I buy an SSD now or wait for prices to drop?
We do not forecast, so the honest answer is a rule rather than a date. If the storage is causing a real problem now, buy now — the cost of running out of space exceeds any plausible saving from waiting. If you have genuine flexibility, set a price alert on the specific drive and let it tell you, because the moves worth acting on are large and infrequent. What we would not do is wait for 2024 pricing, which nothing in the published supply picture supports.
Is the SSD shortage the same as the RAM shortage?
They share a cause but not a mechanism. High-bandwidth memory for AI accelerators competes with conventional DRAM for the same wafers; it does not compete with NAND flash. On our observations the two behaved differently: the DDR5 index moved +7.5% while the SSD index moved −0.5%, both computed by the same formula from the same scrapes. Budget the two categories separately.
Does buying a bigger SSD still cost less per gigabyte?
Not reliably, on what we currently observe. The usual rule that a 4 TB drive is cheaper per gigabyte than a 2 TB one does not hold across every drive we track, so it is worth checking rather than assuming. Our per-drive table prints the price per gigabyte for every capacity we hold, which turns that into a ten-second check instead of an article of faith.
Why does a drive sometimes vanish from your price table?
Because it went out of stock. An unavailable listing records no price here rather than carrying the last observed price forward, since carrying it forward would invent an observation that never happened. A drive with no in-stock observation inside the lookback window is shown as having none rather than being given a stale price. In a constrained market that absence is usually the earliest signal you get.
Where do these SSD prices come from?
They are scraped from live product pages at Newegg and B&H, both of which permit it in robots.txt, and each observation is stored with a timestamp. Amazon is accessed through the Keepa API and never scraped. Per SKU we take the lowest in-stock price across retailers, divide by capacity, and take the median across SKUs; a category with fewer than 5 SKUs is withheld rather than published as a median. Demo rows are flagged in the database and blocked from public pages at the database layer.
Watch the drive, not the news cycle
We track NVMe, DDR5 and DDR4 listings at Newegg and B&H and tell you when one of yours moves. No deal scores, no affiliate links, no commission on anything you buy — observed prices, dated, and what they mean.