How Often Do RAM Prices Change in 2026? We Counted Every Observed Move
Key takeaways
- Across 17 tracked listings we count 99 price changes in 200 consecutive observations — the price was unchanged from the time before in 50.5% of them. Not one competing page publishes a count of any kind.
- Our most closely watched memory listing is scraped every 2.0 days and repriced 9 times in 88 days — once every 10 days, with one price held for 20 days. Not weekly, and nowhere near daily.
- 2 of them did not change price at all: Kingston Fury Beast DDR5-6000 32GB (2x16GB) has sat at $559.00 for 80 days, and G.Skill Ripjaws V DDR4-3600 CL18 32GB (2x16GB) has sat at $239.99 for 80 days. A flat listing is invisible to every page describing this market.
- Falls are slightly more common than rises (50 against 49) and far smaller: the median rise is +4.84% against −1.90%, a ratchet of 2.5x. Frequent small discounts and rare large rises feel like a falling market.
- The basket travelled 578.0% of price movement to end up 186.1% away from where it started — 3.1x more motion than direction. That ratio is what volatility should mean, and nobody publishes it.
- How often do RAM prices change? Every move, counted
- The listings that never changed price at all
- How often RAM prices change depends on how often you look
- Falls are more common; rises are bigger
- Distance travelled against distance moved
- What the pages answering this question actually publish
- A distributor quote and a shelf price are different numbers
- What to do with this if you are buying this month
- How these numbers are produced, and what they cannot tell you
- Related reading
- FAQ
Ask how often do RAM prices change and you get an adjective. One of the pages ranking for it says memory now behaves like stock market quotes and fluctuates sometimes weekly; another quotes a shop sign warning that prices change drastically every day. Neither counts a single change, and we can: across 17 listings we hold 200 consecutive observations, and 50.5% of them carried the same price as the time before. That matters because the advice built on top of the adjective — refresh the page daily, buy the moment you see a dip — costs you attention you could spend on the thing that actually moves the bill.
So we counted. Every figure below comes from our own dated in-stock observations at US retailers, every change is bracketed by the interval it happened inside rather than dated to a day we did not watch, and the densely and sparsely scraped halves of the basket are measured separately rather than averaged into one number that describes neither.

How often do RAM prices change? Every move, counted
The unit here is a consecutive pair of observations: each time we scrape a listing we record the price, and if it differs from last time, that is one change. We never have to guess what happened between two scrapes, and the count is checkable against the series plotted on the RAM price chart and the SSD chart.
| Listing | Observations | Sampled every | Changes | Per 30 days | Longest flat run | Latest |
|---|---|---|---|---|---|---|
| Samsung 990 Pro 2TB NVMe Gen4 SSD | 44 · 88d | 2.0d | 21 (10↑ 11↓) | 7.15 | 6d | $408.95 (Oct 27) |
| Corsair Vengeance DDR5-6000 CL30 32GB (2x16GB) | 41 · 88d | 2.0d | 9 (5↑ 4↓) | 3.06 | 20d | $559.99 (Oct 28) |
| WD Black SN850X 2TB NVMe Gen4 SSD | 9 · 80d | 10.0d | 8 (3↑ 5↓) | 3.00 | 0d | $374.92 (Oct 20) |
| Crucial T500 2TB NVMe Gen4 SSD | 9 · 80d | 10.0d | 8 (2↑ 6↓) | 3.00 | 0d | $369.00 (Oct 20) |
| Samsung 990 Pro 4TB NVMe Gen4 SSD | 9 · 87d | 10.0d | 8 (3↑ 5↓) | 2.76 | 0d | $796.50 (Oct 27) |
| Crucial Pro DDR4-3200 64GB (2x32GB) | 9 · 80d | 10.0d | 7 (3↑ 4↓) | 2.62 | 10d | $583.88 (Oct 20) |
| SK hynix Platinum P41 2TB NVMe Gen4 SSD | 9 · 80d | 10.0d | 6 (2↑ 4↓) | 2.25 | 10d | $446.35 (Oct 20) |
| G.Skill Flare X5 DDR5-6000 CL36 32GB (2x16GB) | 9 · 80d | 10.0d | 5 (3↑ 2↓) | 1.87 | 20d | $529.00 (Oct 20) |
| Crucial Pro DDR5-5600 64GB (2x32GB) | 9 · 80d | 10.0d | 5 (3↑ 2↓) | 1.87 | 10d | $1,199.99 (Oct 20) |
| Corsair Vengeance LPX DDR4-3200 CL16 32GB (2x16GB) | 8 · 84d | 10.0d | 5 (4↑ 1↓) | 1.78 | 27d | $259.99 (Oct 24) |
| G.Skill Trident Z5 Neo DDR5-6000 CL30 32GB (2x16GB) | 9 · 80d | 10.0d | 4 (4↑ 0↓) | 1.50 | 20d | $699.99 (Oct 27) |
| Kingston Fury Beast DDR4-3200 32GB (2x16GB) | 9 · 80d | 10.0d | 4 (2↑ 2↓) | 1.50 | 20d | $319.99 (Oct 27) |
| Kingston KC3000 2048GB NVMe Gen4 SSD | 9 · 87d | 10.0d | 4 (2↑ 2↓) | 1.38 | 20d | $499.00 (Oct 27) |
| G.Skill Trident Z5 RGB DDR5-6400 CL32 32GB (2x16GB) | 9 · 87d | 10.0d | 3 (3↑ 0↓) | 1.03 | 20d | $659.99 (Oct 27) |
| Crucial P3 Plus 1TB NVMe Gen4 SSD | 9 · 80d | 10.0d | 2 (0↑ 2↓) | 0.75 | 50d | $187.46 (Oct 20) |
| Kingston Fury Beast DDR5-6000 32GB (2x16GB) | 7 · 80d | 10.0d | none | 0.00 | 80d | $559.00 (Oct 20) |
| G.Skill Ripjaws V DDR4-3600 CL18 32GB (2x16GB) | 9 · 80d | 10.0d | none | 0.00 | 80d | $239.99 (Oct 20) |
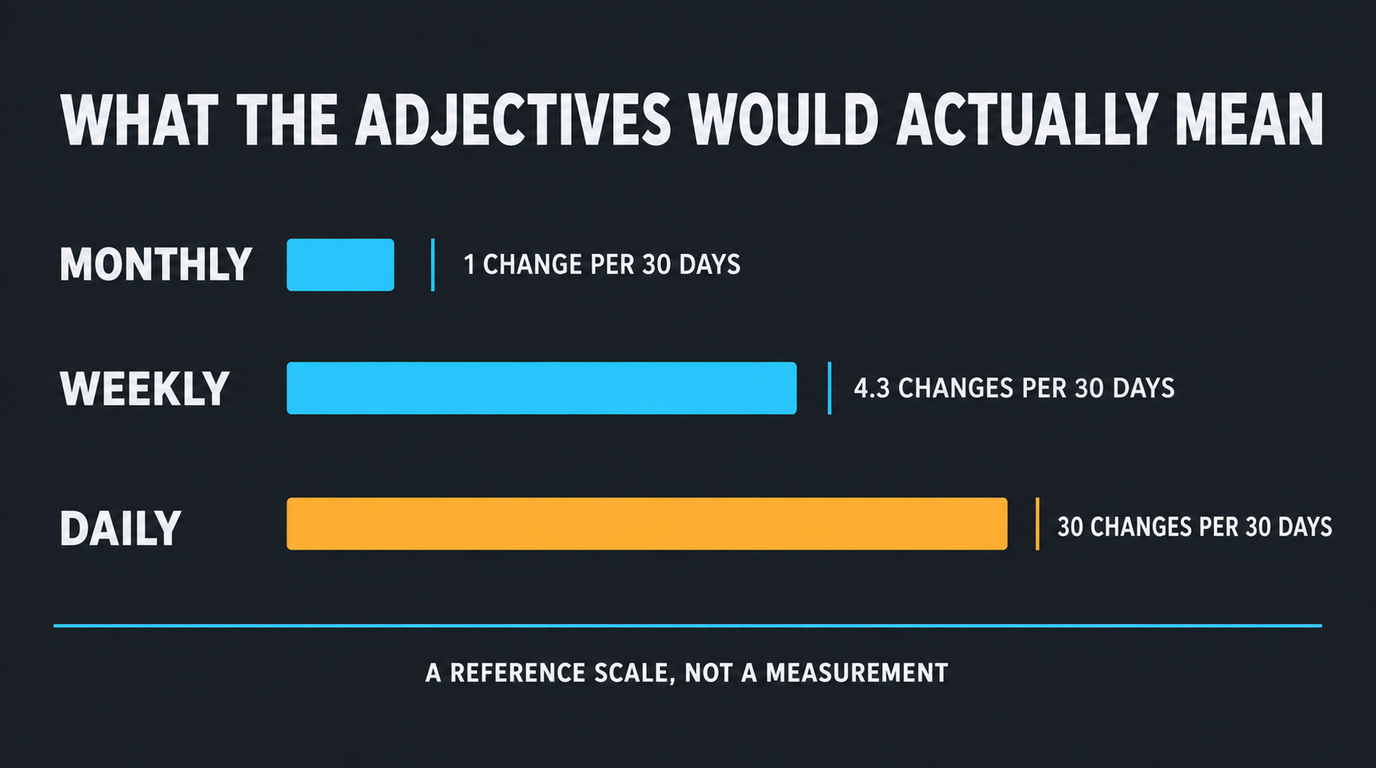
Read the per-30-days column, not the raw count. The median listing records 1.87 observed changes a month and the busiest 7.15. “Weekly” means 4.3 a month and “daily” means 30. Nothing here is close to either. 3 listings are missing from the table because they hold fewer than 5 observations — with two points, one change reports as a 100% change rate, which is a statistic made of a single event.
The listings that never changed price at all
The clearest test of a frequency claim is a listing that fails it completely, and the basket holds 2. A price that does not move is not a data gap — each of these listings was scraped on schedule and returned an in-stock price every time. It was simply the same price.
Kingston Fury Beast DDR5-6000 32GB (2x16GB) — 7 observations across 80 days, every one of them at $559.00. Not a cent of movement, up or down, in DDR5.
G.Skill Ripjaws V DDR4-3600 CL18 32GB (2x16GB) — 9 observations across 80 days, every one of them at $239.99. Not a cent of movement, up or down, in DDR4.
A page calling this market stock-market-like has no room for these rows.
The longest-flat-run column generalises it. The longest in the basket right now runs to 80 days, and a buyer checking that listing daily would have seen one number throughout.
How often RAM prices change depends on how often you look
Here is what makes most published volatility figures uninterpretable: a price series is a sample, not a recording. Scrape a listing every ten days and you miss any move that reverses before the next visit, so the count runs low and the moves it catches are the big ones that survived. Scrape the same listing every two days and you see more changes, each smaller. Both series describe one listing honestly and they disagree.
Our scrape cadence is set per listing and currently runs between two and ten days, which splits the basket cleanly in two. We refuse to average across it:
| Sampling | Listings | Median gap | Pairs examined | Pairs that differed | Median change | Changes per 30 days |
|---|---|---|---|---|---|---|
| Every 5 days or sooner | 2 | 2.0 days | 83 | 30 (36.1%) | 2.2% | 5.11 |
| Less often than 5 days | 15 | 10.0 days | 117 | 69 (59.0%) | 3.6% | 1.78 |
The sparse half shows 59.0% of observations differing against 36.1% for the dense half, and a median change of 3.6% against 2.2%. A pooled figure would sit between them and describe neither. Every number in the sparse row is a lower bound on frequency and an upper bound on size.
So the densely sampled listings are the ones that can test a daily claim, and the memory side has one: Corsair Vengeance DDR5-6000 CL30 32GB (2x16GB), scraped every 2.0 days, 41 observations across 88 days. If it repriced daily, nearly every pair would differ. In fact 9 of 40 did — 22.5% — with its longest unbroken price running 20 days. Daily repricing here is not a claim we failed to confirm; it is one the data rules out.
Falls are more common; rises are bigger
Counting changes and sizing them are two different measurements, and splitting them apart is where the interesting thing in this basket lives. Everyone reports the direction — prices are rising — which is true of the level and not of the count.
| Direction | Count | Share of changes | Median size | What it means for a buyer |
|---|---|---|---|---|
| Price rose | 49 | 49.5% | +4.84% | The move you cannot wait out |
| Price fell | 50 | 50.5% | −1.90% | The move you probably will not notice |
| All changes | 99 | of 200 observation pairs | 3.2% | 36.4% were 5% or more; 17 were 10% or more |
Falls are the slightly more common event and 2.5x smaller than rises at the median. That is a ratchet: a steady drip of small discounts, punctuated by the occasional large step up. Watch casually and you see mostly green; check what you paid three months ago and you are paying more.
The tail matters too: 36.4% of changes were 5% or larger and 17 were 10% or larger, against a median of 3.2%. The largest we hold is SK hynix Platinum P41 2TB NVMe Gen4 SSD at +59.3% — and because the observations bracketing it sit 10 days apart, all we can say is that it happened somewhere in that window. A small median with a fat tail is why a fixed percentage threshold behaves badly here, as the alert threshold piece works through.
Distance travelled against distance moved
“How often” is the wrong question on its own. A listing can reprice twenty times and finish the quarter within a dollar of where it started, or reprice twice and double. What a buyer wants to know is how much of that movement went anywhere — so we add up the size of every change, ignoring direction, and compare that path with the net move.
| Listing | Changes | Path travelled | Net move | Path ÷ net | Direction reversals |
|---|---|---|---|---|---|
| SK hynix Platinum P41 2TB NVMe Gen4 SSD | 6 | 121.7% | −0.6% | 206.2x | 3 of 5 |
| Crucial Pro DDR5-5600 64GB (2x32GB) | 5 | 61.8% | +15.9% | 3.9x | 4 of 4 |
| Corsair Vengeance DDR5-6000 CL30 32GB (2x16GB) | 9 | 60.3% | +7.7% | 7.8x | 4 of 8 |
| Kingston Fury Beast DDR4-3200 32GB (2x16GB) | 4 | 57.4% | −8.6% | 6.7x | 1 of 3 |
| Kingston KC3000 2048GB NVMe Gen4 SSD | 4 | 42.3% | +39.1% | 1.1x | 1 of 3 |
| Crucial T500 2TB NVMe Gen4 SSD | 8 | 33.8% | −5.4% | 6.3x | 4 of 7 |
| Crucial Pro DDR4-3200 64GB (2x32GB) | 7 | 33.1% | +8.3% | 4.0x | 6 of 6 |
| Corsair Vengeance LPX DDR4-3200 CL16 32GB (2x16GB) | 5 | 32.0% | +25.8% | 1.2x | 2 of 4 |
SK hynix Platinum P41 2TB NVMe Gen4 SSD is the clearest case: 6 changes totalling 121.7% of movement, to finish −0.6% from where it opened — 206.2x more motion than direction, with 3 of its 5 later moves reversing the one before.
Basket-wide the figure is 3.1x: 578.0% of price movement to produce 186.1% of net drift. Most of what a daily watcher sees here is round-trip, and the levers that are not — which part, which capacity — are worth more than the timing, which is what what waiting has actually cost measures kit by kit.
What the pages answering this question actually publish
We scored the pages ranking for this question on one thing: does the page count a price change. None does. The interesting case is a tracker taking thirty daily snapshots a month, which averages them into a month-end figure and throws the changes away — so the raw material for this measurement exists on the open web and nobody has published it.
| Source | Date | Length | What it says about frequency | Counts a change? | $/GB |
|---|---|---|---|---|---|
| ipc2u.com, RAM prices 2026 | 10 Dec 2025 | ~2,500–3,000 words | “Behave like stock market quotes”; “fluctuate sometimes weekly” | No — no price table at all | No |
| rampricesusa.com, September index | data to 30 Sep 2026 | ~2,500–3,000 words | Nothing — monthly averages from 30 daily snapshots | No — the snapshots are averaged, the changes discarded | Yes ($18.48 DDR5, $8.15 DDR4, Amazon list prices) |
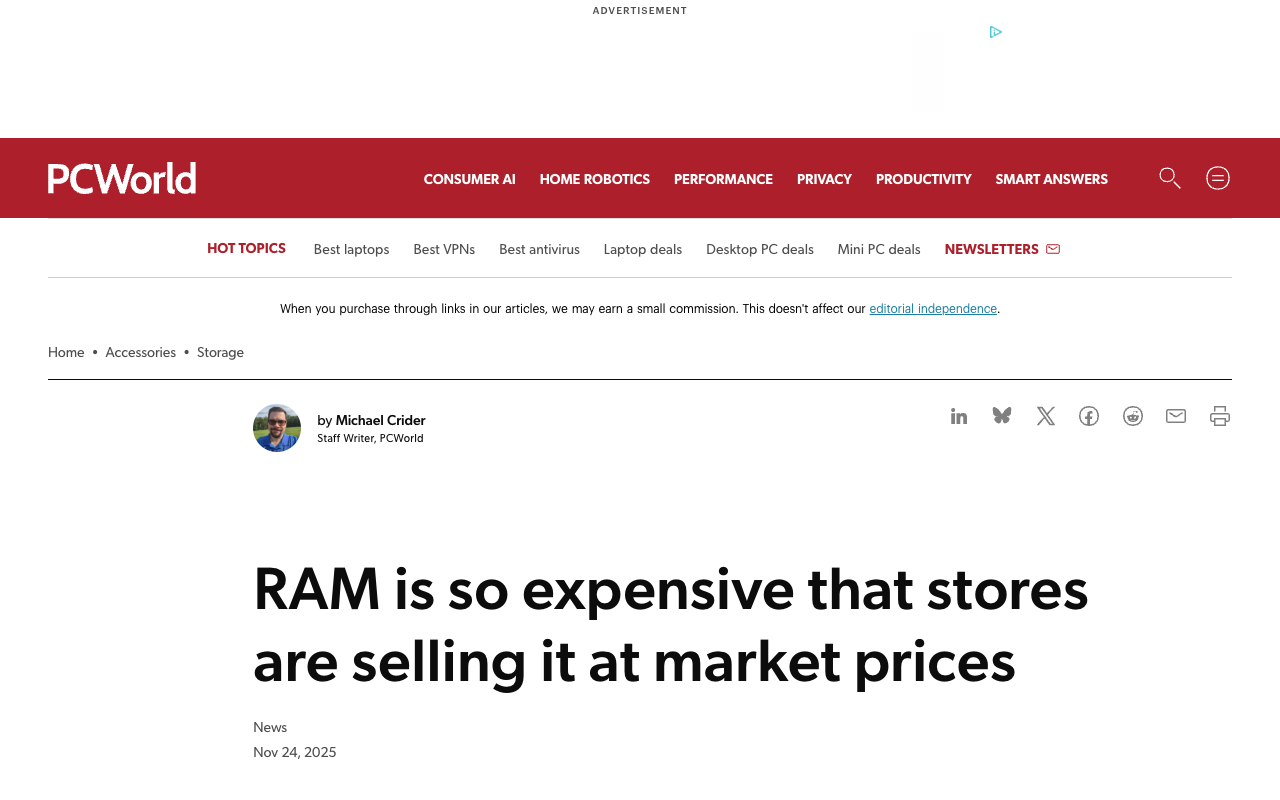
| pcworld.com, stores selling at market prices | 24 Nov 2025 | ~800 words | A store sign saying prices “change drastically every day” | No — no tables | No |
| simcentric.com, why memory prices keep rising | 26 Jun 2026 | ~3,500 words | Nothing measured; forecast tables by quarter | No — two price points in three months | No |
| This page | renders live | this length | A count, per listing, with the sampling interval printed | Yes — every change, its size and the gap it sits inside | On the per-GB pages, dated |
Two of the most confident pages are from November and December 2025 and still rank in October 2026, which matters here: they describe the peak of the memory panic, when published contract figures really were moving every few weeks. A claim about repricing frequency has a date attached whether or not the page says so.
A distributor quote and a shelf price are different numbers
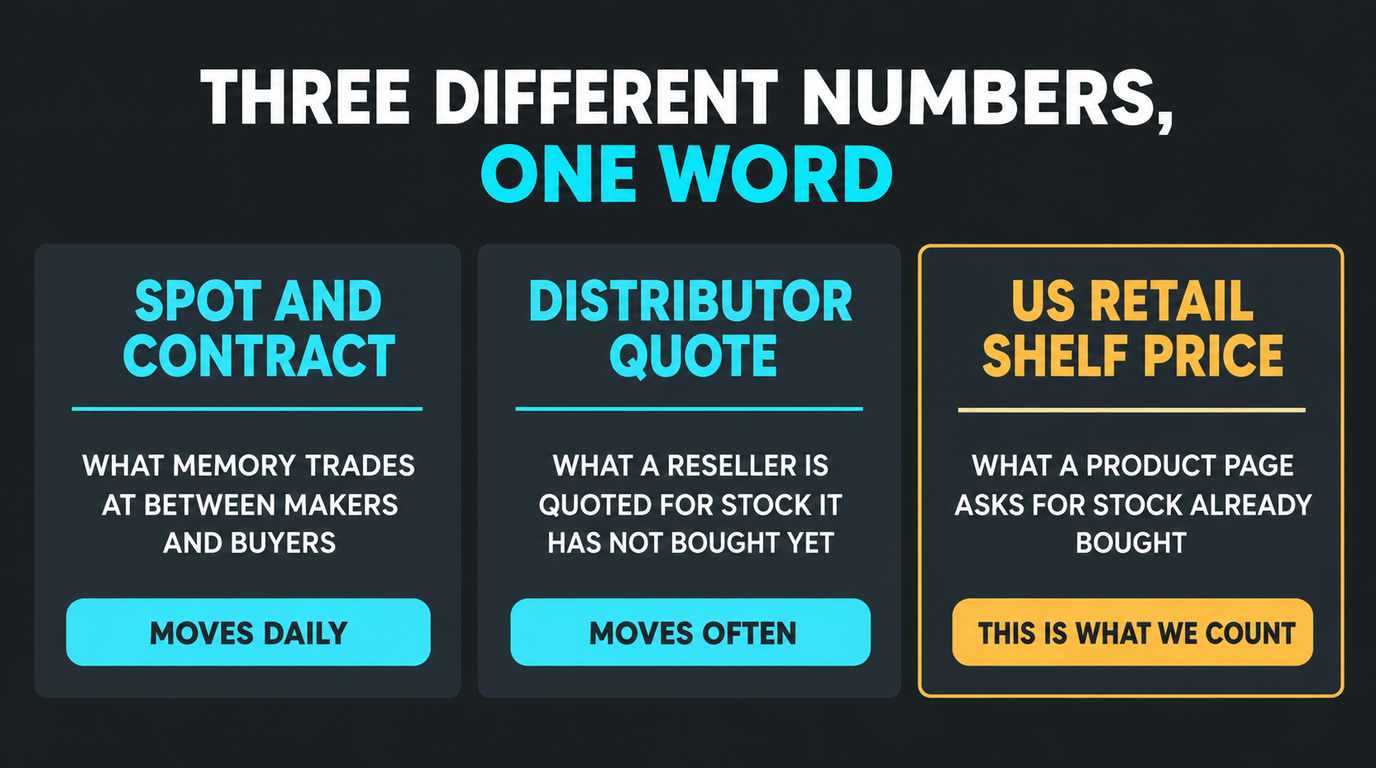
There is a real phenomenon underneath the adjective, worth separating from ours. Distributor and spot quotes for memory genuinely do move daily. What we measure is the third thing: the price on a US retail product page, which a retailer sets from inventory it already bought and reprices on its own schedule. The page describing memory as stock market quotes is talking mostly about the first market and the store sign PCWorld photographed is a retailer declining to print a number it expects to change. Neither is evidence about a Newegg listing, which is the number you pay.
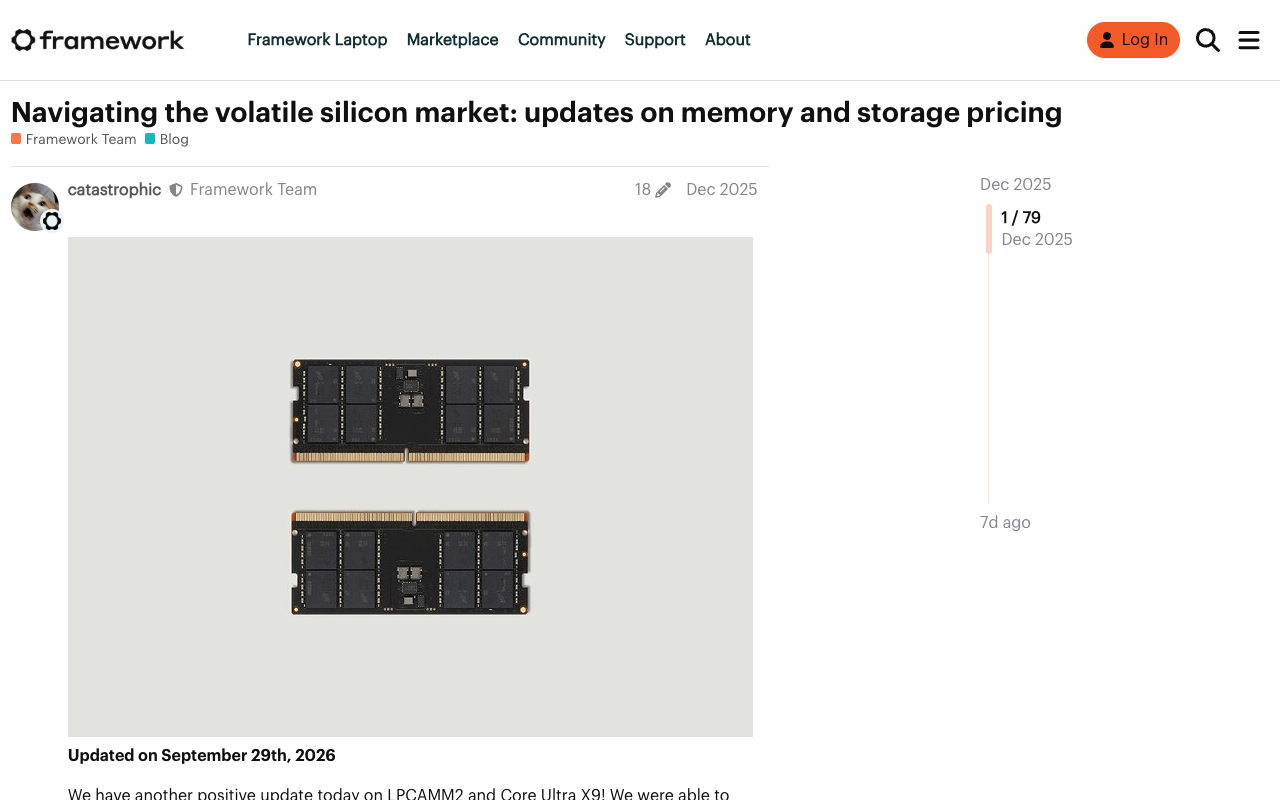
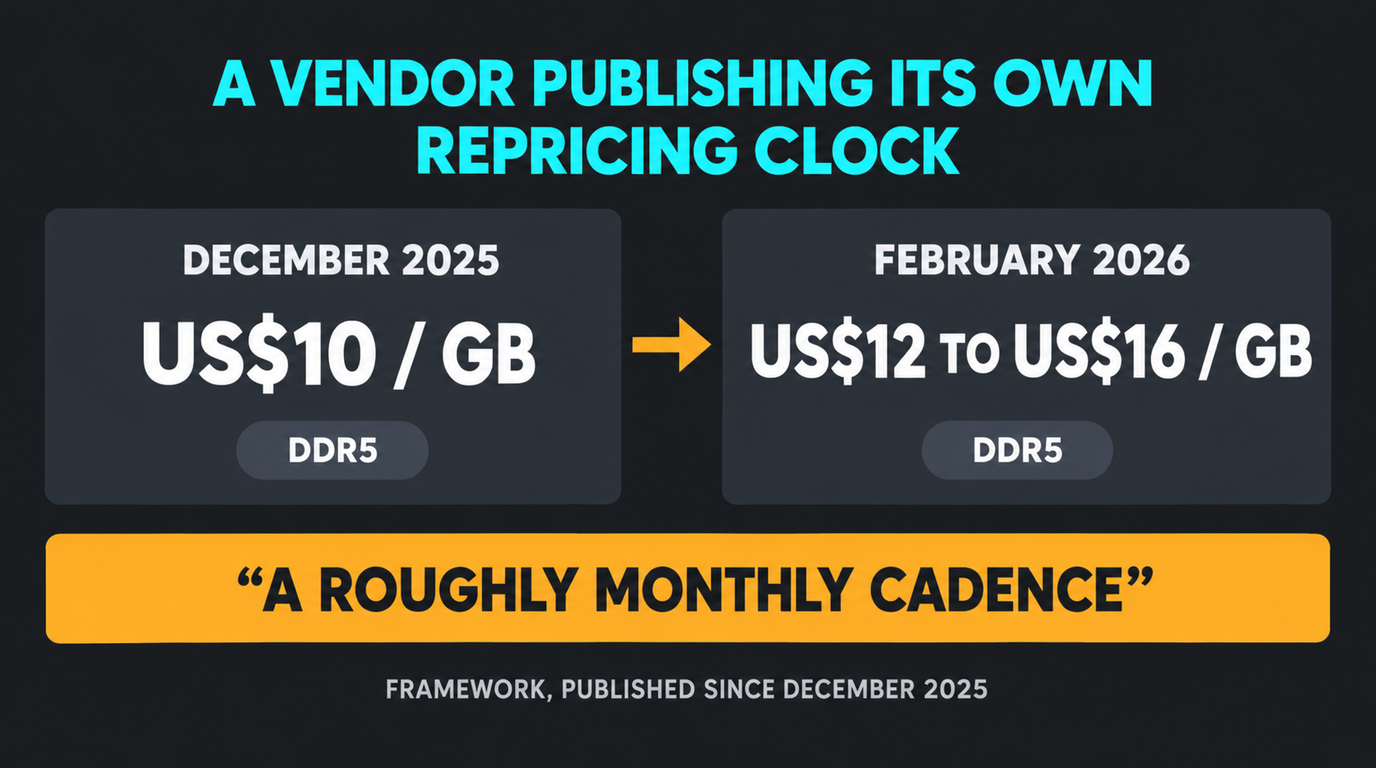
The cleanest outside confirmation is a vendor publishing its own repricing cadence. Framework has posted memory and storage price changes publicly since December 2025 and describes its schedule as “a roughly monthly cadence”, moving DDR5 to $10/GB that month and to $12–$16/GB by February 2026. A company whose costs are set in the volatile market reprices monthly — the clock our count keeps finding.
What to do with this if you are buying this month
Three things follow from the count, and none of them is “check daily”.
Stop refreshing and start comparing. With 3.1x more motion than direction, hours spent watching one listing compete with a far bigger lever: the gap between two kits of the same capacity on the same day. Our tracked SKU list prints price per gigabyte for every part we hold.
Set a threshold above the noise, not below it. A median change of 3.2% means a watch set at 2% fires on movement that reverses, and one set at 15% almost never fires.
Treat a flat listing as a price, not as a missing observation. The listings above held one number for months. If one is the part you want, there is nothing to time.
How these numbers are produced, and what they cannot tell you
Every figure is a recorded in-stock observation from a live product page at Newegg or B&H, both of which permit it in robots.txt (Amazon is only ever reached through the Keepa API). An out-of-stock listing records no price rather than repeating the last one — carrying a price forward would invent an observation and, here, a non-change.
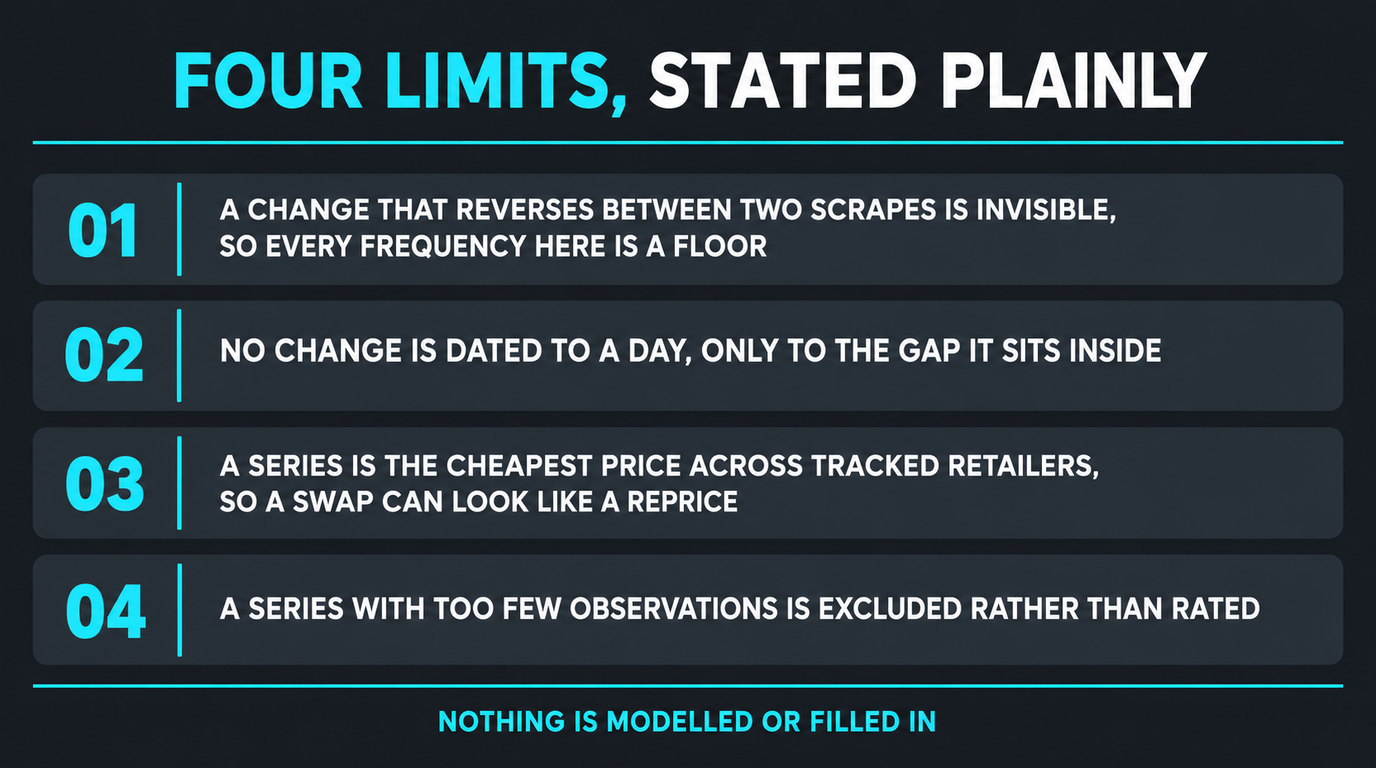
Four limits worth stating plainly. We cannot see a change that reverses between two scrapes, so every frequency figure on this page is a floor. We cannot date a change to a day unless the observations bracketing it are a day apart, which none of ours are — so each change carries the gap it sits inside and we never name a date for it. A series is the cheapest price across the retailers we track for that part, so for the one part in our basket currently priced at two retailers, a change in the series can be the cheaper retailer swapping rather than either one repricing; every other series is a single listing’s own path. And a series under 5 observations is excluded entirely — 3 are today — rather than contributing a rate built from one pair.
This is not a measurement of the whole memory market. It is 17 listings of mainstream desktop DDR5, DDR4 and NVMe parts at US retail, and a basket this size can be moved by one listing — which is why every table prints its sample. Nothing is modelled or filled in.
Related reading
FAQ
How often do RAM prices change in 2026?
Less often than the pages answering this question suggest. On our basket of tracked US retail listings, most record one to three observed price changes a month, and at the time of writing two have not changed price at all across our window. The live table on this page prints the count, the sampling interval and the longest flat run for every listing, because the honest answer is per-listing rather than market-wide.
Do RAM prices really change daily?
Not on the retail listings we can test. The claim is usually true of distributor and spot quotes, which do move daily — but a retail product page is priced from inventory the retailer already bought. Our most closely watched memory listing is scraped every two days, and most consecutive pairs carry the same price as the one before. If it repriced daily, nearly all would differ.
Why do published answers disagree about how volatile RAM prices are?
Mostly because they measure different markets — contract, spot and shelf prices move on different clocks — and partly because a price series is a sample. A listing checked every ten days shows fewer changes, each larger, than the same listing checked every two days. A frequency figure published without its sampling interval cannot be compared with any other, which is why we print ours and split the basket by it.
Are RAM price drops more common than increases?
In our window the counts are close, with falls slightly ahead — but the sizes are not, and the median rise has been several times the median fall. That combination feels like a falling market and is not one. The live table splits count from size, because reporting only one tells half the story.
How much does a RAM price change by when it changes?
The median observed change in our basket sits in the low single digits of a percent, with a long tail: roughly a third of changes are 5% or more and a handful exceed 10%. That shape is why a fixed percentage alert threshold behaves badly here — set it near the median and it fires on movement that reverses, set it near the tail and it almost never fires.
Should I check RAM prices every day before buying?
The count argues against it. Across our basket, total price movement has run well over twice the net drift, so most of what a daily watcher sees is round-trip. The levers that are not — which part you pick at a given capacity, and which capacity — are visible in one screen on our tracked SKU list. Set a threshold that clears the typical change size and let it do the watching.
What does a gigabyte of DDR5 cost right now?
Our median current in-stock observation puts DDR5 at $18.75 per gigabyte across 7 kits, cheapest $16.53, dearest $21.87. That spread inside one generation is larger than most of the changes this page counts, which is the practical point of the exercise.
Let the threshold do the watching
We track DDR5, DDR4 and NVMe listings at US retailers and tell you when one of yours moves past your number. No forecasts, no deal scores, no affiliate links, no commission on anything you buy — observed prices, dated, with the sample size printed next to them.
Context: DDR5 from $16.53/GB, NVMe Gen4 from $0.184/GB, cheapest in-stock observations in the last 30 days.