Best SSD Brand in 2026: The Price Ranking Inverted in One Quarter
Key takeaways
- At 2 TB the badge is worth 32.1% per gigabyte across 5 brands — $130.00 in cash on the same amount of storage. Every figure here is a dated in-stock retailer observation and re-renders when the shelf moves.
- The ranking moved: Crucial now holds the cheapest gigabyte where WD did at the open. No published brand ranking we found carries a change of any kind.
- 1 of 5 listings did it. The other 4 moved between −5.4% and +14.2%. A ranking two listings can rearrange was never a ranking of the brands.
- The cheapest drive and the cheapest gigabyte are checked separately, because they are not always the same drive. Sort by the unit you actually pay in.
- Capacity is still the bigger lever: Samsung's own 2 TB and 4 TB differ by −2.6% per gigabyte with the badge held still. A brand ranking that does not name a capacity is measuring two things and reporting one.
- What each badge costs per gigabyte today
- The best SSD brand in 2026 changed twice over
- Two listings moved it, not five brands
- The cheapest drive is not the cheapest gigabyte
- One badge, two capacities: the control
- Why the published rankings cannot show you this
- What a doubled price is, and what it is not
- Picking the best SSD brand when the ranking has a shelf life
- How these numbers are produced
- Related reading
- FAQ
Asking which is the best SSD brand in 2026 gets you a tier list: this badge is the reliable one, that badge is the value one, this other one is for gamers. Four of the pages ranking for it publish no dollar figure at all, and the two that do attach no date to any of them. That is a problem worth $130.00, because inside the one capacity where we can price 5 badges against each other today, the gap from the cheapest gigabyte to the dearest is 32.1%. A tier list cannot tell you that, nor the thing we found on reading the same ranking twice: its two ends traded places inside a quarter. This page prices every badge we track at one capacity, on one interface, at a named retailer, with the date on every figure — then does it again at the start of our window to show what the ordering is worth.
We read the four pages ranking for this on 2 October 2026 and scored them on what a buyer can check. None of them publishes a price per gigabyte, none dates the prices it does publish, and none states a basket — which is why the ordering they describe and the ordering we observe disagree at both ends. Ours, cheapest gigabyte first, currently runs Crucial → WD → Samsung → SK hynix → Kingston. In July it ran WD → Kingston → Samsung → Crucial → SK hynix.
What each badge costs per gigabyte today
A brand comparison is only a brand comparison if everything except the brand is held still. That sounds obvious and almost nothing published does it: the rankings we read move capacity, interface generation and product tier along with the badge, so a brand with a cheap 8 TB drive in the list outranks one represented by a 500 GB model. The table below holds capacity at 2 TB and the interface at PCIe 4.0 across 5 drives of 5 brands. Every row is the cheapest current in-stock observation for that drive, with the retailer and the day we recorded it.
| Brand | Drive | Price | Per GB | Per TB | Vs cheapest | Observed |
|---|---|---|---|---|---|---|
| Crucial | Crucial T500 2TB NVMe Gen4 SSD | $369.00 | $0.1845/GB | $184.50/TB | — | Newegg · Oct 20, 2026 |
| WD | WD Black SN850X 2TB NVMe Gen4 SSD | $374.92 | $0.1875/GB | $187.46/TB | +1.6% | Newegg · Oct 20, 2026 |
| Samsung | Samsung 990 Pro 2TB NVMe Gen4 SSD | $408.95 | $0.2045/GB | $204.47/TB | +10.8% | Newegg · Oct 27, 2026 |
| SK hynix | SK hynix Platinum P41 2TB NVMe Gen4 SSD | $446.35 | $0.2232/GB | $223.18/TB | +21.0% | Newegg · Oct 20, 2026 |
| Kingston | Kingston KC3000 2048GB NVMe Gen4 SSD | $499.00 | $0.2437/GB | $243.65/TB | +32.1% | Newegg · Oct 27, 2026 |
The median gigabyte in that cohort costs $0.2045/GB, or $204.47/TB. The spread around it is the number worth carrying: 32.1% from the cheapest badge to the dearest, on identical capacity. Take the dearest drive out and it is still 21.0% — so the headline is not resting on one odd listing, though one listing is doing most of the work, which the next two sections are about. Every tracked drive with a live price in this cohort is in the table.
The best SSD brand in 2026 changed twice over
Here is the measurement no competing page makes. A ranking is a claim about an ordering, and an ordering can be read twice. So we ranked the same cohort on the same unit at each drive’s first observation inside our window, and again at its current offer.
| Position | Then | Its $/GB | Now | Its $/GB | Change |
|---|---|---|---|---|---|
| Cheapest | WD (Aug 1) | $0.1642/GB | Crucial (Oct 20, 2026) | $0.1845/GB | was #2 → #1 |
| #2 | Kingston (Aug 1) | $0.1751/GB | WD (Oct 20, 2026) | $0.1875/GB | was #5 → #2 |
| #3 | Samsung (Jul 31) | $0.1943/GB | Samsung (Oct 27, 2026) | $0.2045/GB | held position |
| #4 | Crucial (Aug 1) | $0.1950/GB | SK hynix (Oct 20, 2026) | $0.2232/GB | was #1 → #4 |
| Dearest | SK hynix (Aug 1) | $0.2245/GB | Kingston (Oct 27, 2026) | $0.2437/GB | was #4 → #5 |
The cheap end changed hands: Crucial now holds the cheapest gigabyte at $0.1845/GB, where WD held it at $0.1642/GB in July. And this is the half that matters more than the headline: Samsung did not move at all. That badge sits in exactly the same position in both orderings. An ordering whose middle is stable while its ends swap is not describing the brands in it.
The spread moved with it. The cohort ran 36.7% from end to end at the open and runs 32.1% now, a factor of 0.87x. So the badge is not merely worth a different amount than it was in July; it is worth considerably less, and in a different direction. Note what this is not: a forecast. These are two dated measurements of the same drives, and the point needs no more — a ranking that has already reordered once has a shelf life, whatever it does next.
Two listings moved it, not five brands
An inverted ranking invites a story about brands — one manufacturer got aggressive, another lost supply. Before telling it, check how many listings actually moved. If the reordering came from one or two drives while the rest sat still, the new ordering is those drives’ repricing wearing five badges.
| Brand | Drive | Open | Now | Change | Reading |
|---|---|---|---|---|---|
| Kingston | Kingston KC3000 2048GB NVMe Gen4 SSD | $358.65 (Aug 1) | $499.00 (Oct 27, 2026 · n=9) | +39.1% | moved the ranking |
| Crucial | Crucial T500 2TB NVMe Gen4 SSD | $389.95 (Aug 1) | $369.00 (Oct 20, 2026 · n=9) | −5.4% | inside the band |
| SK hynix | SK hynix Platinum P41 2TB NVMe Gen4 SSD | $449.00 (Aug 1) | $446.35 (Oct 20, 2026 · n=9) | −0.6% | inside the band |
| Samsung | Samsung 990 Pro 2TB NVMe Gen4 SSD | $388.55 (Jul 31) | $408.95 (Oct 27, 2026 · n=44) | +5.3% | inside the band |
| WD | WD Black SN850X 2TB NVMe Gen4 SSD | $328.38 (Aug 1) | $374.92 (Oct 20, 2026 · n=9) | +14.2% | inside the band |
The cohort’s median absolute move over the window is 5.4%. 4 of the 5 drives sit near it, between −5.4% and +14.2% — a band narrow enough that none of them could have changed the ordering. One drive sit far outside it: Kingston at +39.1%. Those are the listings that rearranged the table.
The cheapest drive is not the cheapest gigabyte
In this cohort the cheapest drive and the cheapest gigabyte are the same drive, so the two sorts agree. They do not always, and we check separately rather than assume.
Neither sort is wrong; which you want depends on what is fixed. The failure is publishing one and calling it the other, which is easy to do by accident because the two tables look equally reasonable and differ by a row. It is also why we group a cohort on the capacity a buyer shops for rather than the raw spec-sheet number: a drive recorded as 2048 GB is one a buyer compares against its 2 TB shelf-mates, so an exact-match test would quietly report the spread over whichever drives survived.
One badge, two capacities: the control
Everything above holds capacity still to isolate the badge. The control is the inverse: hold the badge still and move the capacity. If one brand’s own two sizes differ per gigabyte by as much as two brands do at one size, then a ranking that names no capacity is measuring both levers and reporting one number.
| Brand | Smaller | Larger | Cash step | Per-GB step |
|---|---|---|---|---|
| Samsung | 2 TB · $408.95 $0.2045/GB | 4 TB · $796.50 $0.1991/GB | $387.55 | −2.6% |
| Crucial | 1 TB · $187.46 $0.1875/GB | 2 TB · $369.00 $0.1845/GB | $181.54 | −1.6% |
Samsung is the one badge we can currently price at two capacities: −2.6% per gigabyte from its 2 TB to its 4 TB, $387.55 in cash. Against a brand spread of 32.1% at one capacity, the badge is currently the larger lever of the two — but drop the dearest drive out of the cohort and the brand spread falls to 21.0%, which puts the two levers in the same range. Both decisions are worth real money, and a tier list prices neither. The capacity lever is worked through in detail in the 2 TB versus 4 TB comparison, which runs the same same-line method on size instead of badge.
Why the published rankings cannot show you this
We scored the pages ranking for the brand question on four checkable things. Not one clears all four — and the reason matters more than the scoring, because a ranking built without them cannot detect its own shelf life.
| Source | Length | Tables | Prices | Dated | $/GB | Capacity held still |
|---|---|---|---|---|---|---|
| BGR, brands ranked worst to best | ~2,900 words | 0 | Yes (e.g. a 2 TB flagship at $374.99) | No | No | No — 500 GB to 8 TB in one ranking |
| diskprices.org, longevity and failure rates | short | 1 (qualitative) | None at all | — | No | No — product lines, no capacities named |
| computercompatibility.com, four brands compared | medium | 1 (9 rows) | Yes, as £ ranges | No | No | Yes — standardised to 1 TB |
| digieraglobal.com, top 10 manufacturers | ~3,500–4,000 words | 2 | None at all | — | No (advises comparing it) | No — mixes SATA, Gen3, Gen4, Gen5 |
| This page | this length | 5, four of them live | Yes, named retailer | Yes, every figure | Yes | Yes — one capacity, one interface |
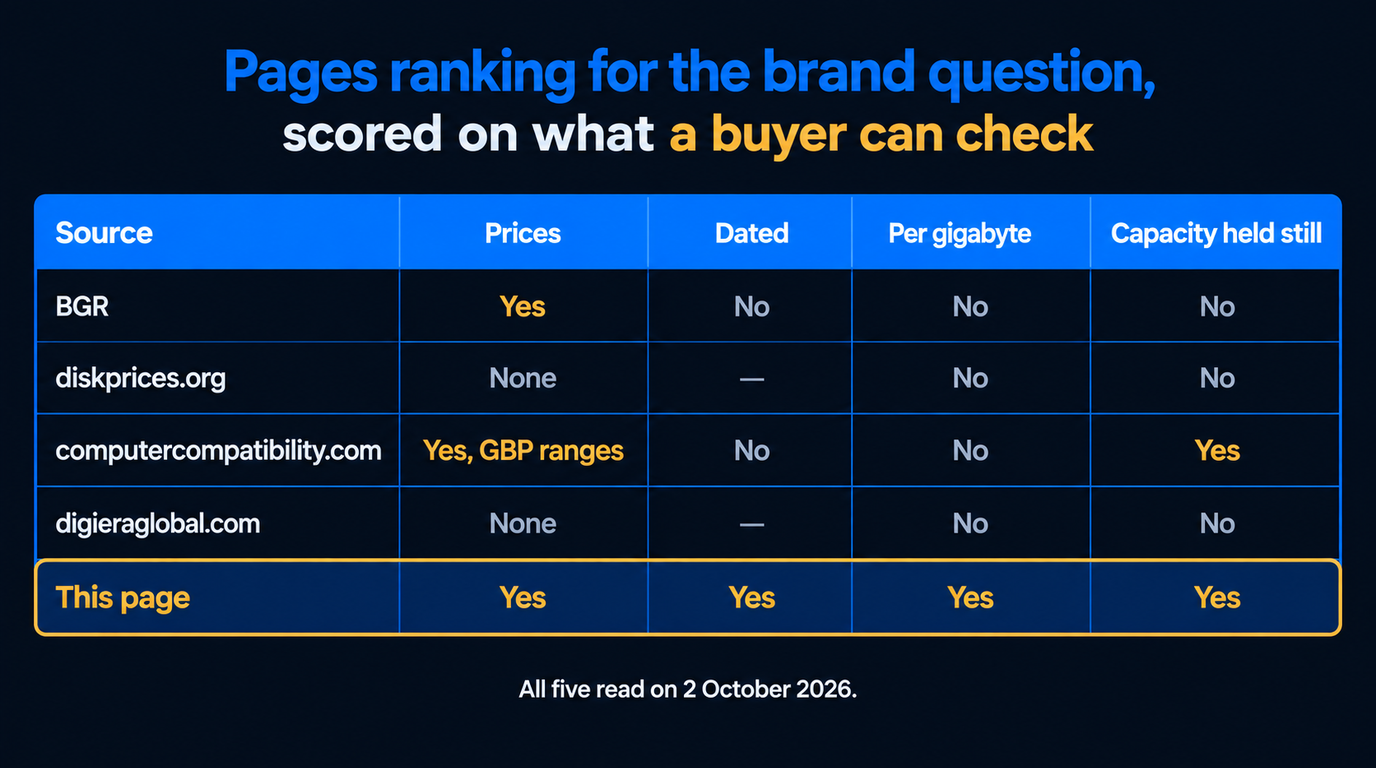
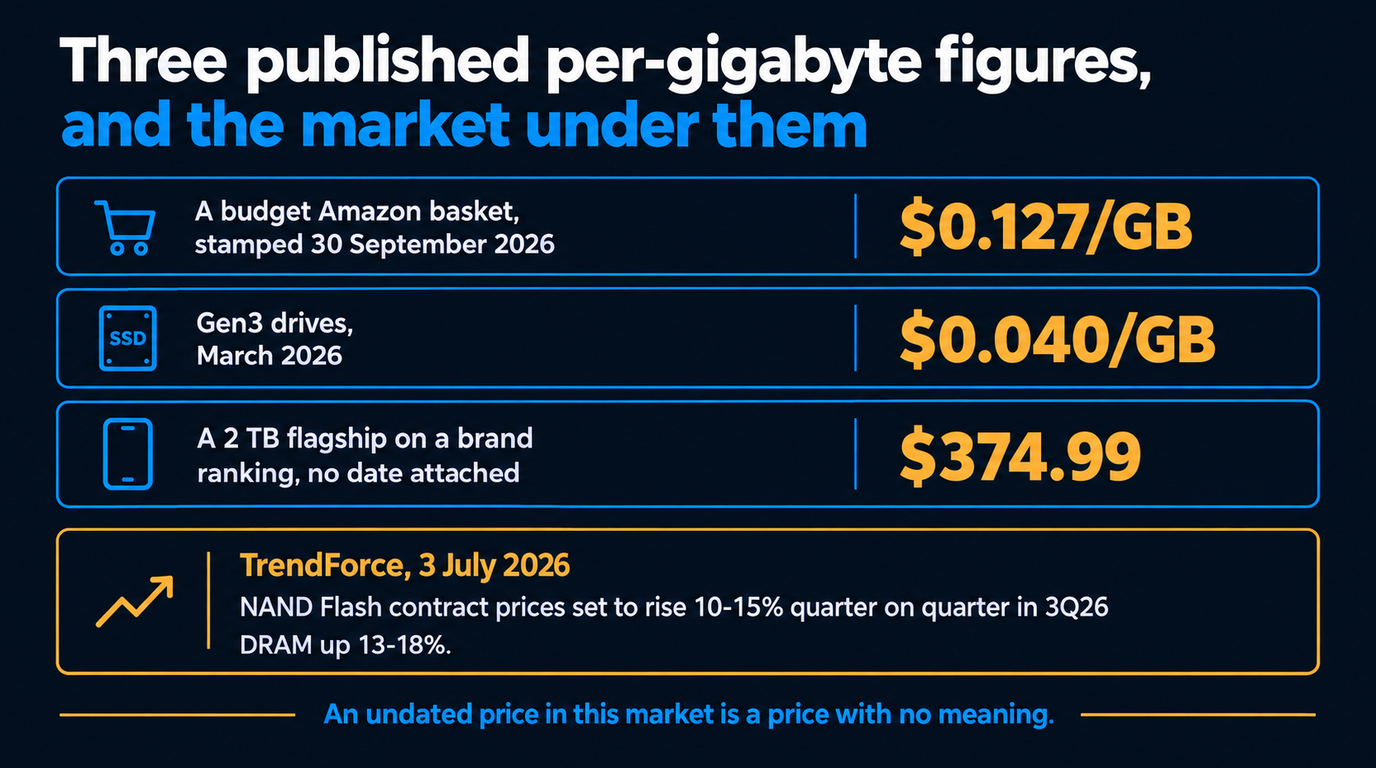
The best of them standardises to one capacity, the right instinct, then publishes undated currency ranges and no per-gigabyte figure — nothing a reader could re-check a quarter later. The one that does publish dollar figures is not far off on the drive we both price: its flagship 2 TB figure of $374.99 sits close to our own current observation. The problem is not that the number is wrong; it is that no date is attached, in a market where TrendForce reported on 3 July 2026 that NAND Flash contract prices were set to rise 10–15% quarter on quarter in 3Q26, with DRAM up 13–18%. An undated price in that market is a price with no meaning, and an undated ordering built from several of them is worse.
The per-gigabyte figures in circulation diverge for the same reason, and none is lying. A tracker with a budget Amazon basket published $0.127/GB, stamped 30 September 2026; another put Gen3 drives at $0.040/GB in March 2026. Our $0.2045/GB median is a mainstream Gen4 basket at one US retailer. Each is right about its own basket, which is why a brand ranking stating none cannot be checked against any of them. The lesson we keep relearning is in the per-gigabyte piece: the top of a price-sorted list is a different class of drive, so a leaderboard rewards whichever badge holds the most aggressive listing that week.

What a doubled price is, and what it is not
The largest mover in this cohort is Kingston’s drive, at +39.1% from $358.65 on Aug 1 to $499.00 on Oct 27, 2026, across 9 observations. That is the figure carrying most of the cohort’s headline spread, and it deserves a careful sentence rather than a dramatic one.
What we can say is what we observed: a single listing repriced far outside what its same-capacity, same-interface peers did, and it is still the live in-stock price at the retailer we track. What we will not say is why. That shape suggests a listing-level supply or availability event rather than a market move — but we have no primary source for the drive’s status, and inventing one would be the opposite of what this site is for.
Picking the best SSD brand when the ranking has a shelf life
None of this says brands are interchangeable. It says the price ordering of brands is not a property of the brands, so it has to be read fresh, at the capacity you are buying, on the day you buy. Four things follow, all of them quick.
Fix the capacity and the interface first, then compare, which removes the larger of the two levers from the comparison. Then sort by the unit your constraint is in — cash if the capacity is fixed, per gigabyte if the budget is. Those two steps are the whole method this page runs.
Check the date on every figure, and treat an undated price as no price. And buy the drive, not the badge: the non-price differences here are real and none appears in a price. Samsung states 7,450MB/s sequential read for the 990 Pro on its own product page, and the WD_BLACK SN850X’s official page now redirects to SanDisk’s site — both checked on 2 October 2026. Endurance, warranty terms and sustained write behaviour live on those pages: the half of the decision this site has no view on.
How these numbers are produced
Everything above comes from in-stock observations at tracked US retailers, each carrying its date. Five rules do the work, and they are why a figure here can differ from a retailer page you open a minute later.
An out-of-stock listing records no price, so a drive with no live offer is dropped from the cohort rather than carried forward — a ranking built partly on month-old prices is the failure this page is about. A move over 60% is held until a second scrape confirms it. A cohort under five drives never gets a median. Prices older than 30 days are not shown as current, and a closing price is read from the current offer, not the last series point, which can be weeks older. The window is 90 days on a series that began in late June 2026.
Related reading
FAQ
Which is the best SSD brand in 2026?
On price there is no durable answer, and that is the finding rather than a dodge. We ranked five badges per gigabyte at one capacity, then ranked the same drives again at their July prices: the two ends traded places while the middle never moved. So the answer is the ordering on the day you buy, at the capacity you are buying, which the live table here prints with a date on every figure. On reliability and warranty we have no view — we price parts, we do not review them.
Why do brand rankings disagree with each other so much?
Mostly because they do not hold capacity and interface still. A ranking that puts one brand’s 8 TB drive against another’s 500 GB model is measuring capacity and calling it brand, and the per-gigabyte curve is steep enough to decide the result on its own. The second reason is basket: a budget tracker and a mainstream Gen4 basket can publish figures several times apart on the same day, both right about what they measured — so a ranking stating no basket cannot be checked against either.
Is the cheapest SSD brand also the cheapest per gigabyte?
Not always, and it is worth checking every time. Capacities sold under one label are not always identical — our basket holds a drive recorded at 2048 GB beside others at 2000 GB, all sold as 2 TB — so the cheapest drive and the cheapest gigabyte can be different drives. Sort by the unit your constraint is in: cash when the capacity is fixed, per gigabyte when the budget is.
How much does the SSD badge actually cost at one capacity?
The spread between the cheapest and dearest gigabyte inside one capacity renders live on this page, because it moves. It has recently been wide enough to matter on a single purchase, and one listing can carry most of it — so we print the spread both with and without the dearest drive, the check that tells you which case you are in.
What does a price per gigabyte for an SSD look like right now?
Our cheapest current in-stock observation puts NVMe Gen4 at $0.184 per gigabyte, with the dearest drive at the same capacity far above it for identical storage. Published figures for this span roughly nine times depending on basket, capacity and interface generation, which is why we print ours with all three stated.
Does a brand’s price doubling mean it is being discontinued?
We will not say, because we cannot observe it. What we can report is that one listing in our cohort repriced far outside what its same-capacity peers did, and that the figure is still the live in-stock price at the retailer we track. That shape suggests a listing-level availability event rather than a market move, but we have no primary source for the drive’s status and will not invent one. Either way, one listing can reorder a brand ranking without anything about the brand changing.
Should I buy a cheaper brand to save money, or step up a capacity?
Price both, because the two levers are often the same size. On our current basket the per-gigabyte gap between brands at one capacity and the gap between one brand’s own two capacities land in a similar range once the dearest listing is set aside, and which is larger changes as listings reprice. Decide the capacity you need first, then compare badges inside it.
Where do these SSD prices come from?
From live product pages at Newegg and B&H, both of which permit scraping in robots.txt — we verify and record that check before a retailer’s first scrape, and Amazon is only ever reached through the Keepa API. Every figure is a recorded in-stock observation with its date; an out-of-stock listing records no price, a move over 60% waits for a second scrape, and nothing older than 30 days is shown as current.
Watch the drive, not the badge
We track NVMe, DDR5 and DDR4 listings at US retailers and tell you when one of yours moves past your threshold. No forecasts, no deal scores, no affiliate links, no commission on anything you buy — observed prices, dated, with the sample size printed next to them.
Context: NVMe Gen4 from $0.184/GB, DDR5 from $16.53/GB, cheapest in-stock observations in the last 30 days.