Why Are SSD Prices Going Up in 2026? How Much of It Reached the Shelf
Key takeaways
- NAND contract prices were published at +10–15% QoQ for 3Q26, and our storage index did not rise over the window at all. Every retail figure here is a dated in-stock observation.
- A gigabyte of NVMe runs $0.1845/GB to $0.2437/GB across 7 tracked drives today. None of the four pages ranking for this question publishes a price per gigabyte at all.
- One listing carried 50.5% of the basket's cash movement. Take it out and the median tracked drive moved +0.2%. “SSD prices are up” is a claim about a basket; you buy one drive.
- Storage and memory came out close at retail — −4.4% and +7.5% — but not over the same window: 23 index points to Oct 21, 2026 against 4 to Aug 13, 2026. The shortage story is not one story.
- The spread sitting on the shelf today inside the 2 TB band is 35.2%, or 8.0x the whole category's move over the window. Which drive you pick is the bigger decision.
- What a gigabyte of NVMe costs at US retail today
- Contract prices and shelf prices are two different numbers
- Why are SSD prices going up: how much reached the shelf
- One listing carried most of the movement
- Storage did not move like memory
- Why the published answers disagree with each other
- What to do about it, without a forecast
- How these numbers are produced
- Related reading
- FAQ
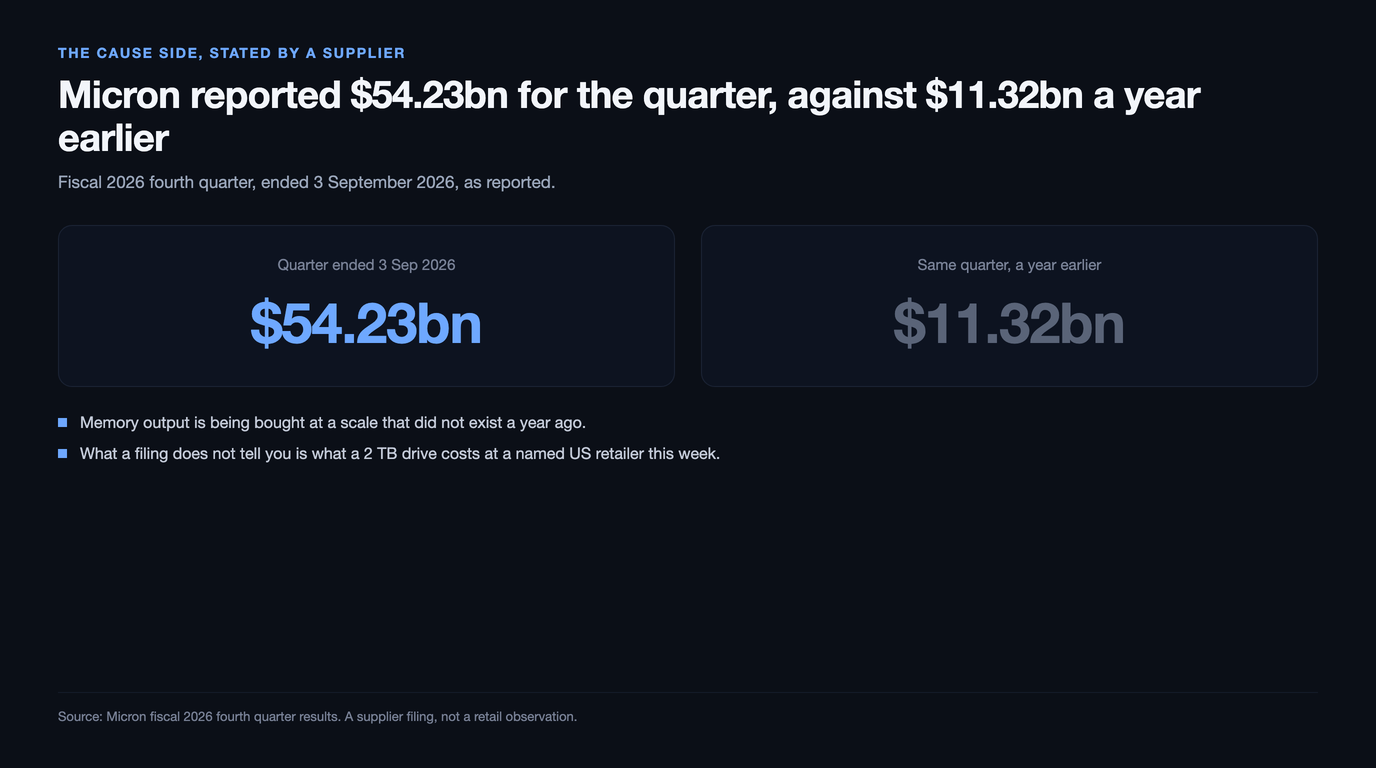
Ask why are SSD prices going up and you get a cause and a percentage: AI data centres are buying the NAND, suppliers cut wafer starts, prices are up as much as 60%, buy now. The cause is well sourced and the percentage is real — but it is a contract percentage, agreed between suppliers and large buyers, and not one of the four pages we read separates it from what a drive costs at a US retailer. That gap is the whole story this page tells, and we measure it rather than assert it: the published contract range for the quarter against our own observed retail index over the same period.
So the answer has two halves and almost everything published carries only the first. We read TrendForce’s own releases for the contract side, scored the four pages ranking for this question on 4 October 2026, and priced every drive we track per gigabyte with the retailer and the date attached. We make no forecast below: the only projections on this page are TrendForce’s own, labelled as theirs.
What a gigabyte of NVMe costs at US retail today
Start with the number the question is actually about. A percentage move means nothing without a level, and a level means nothing without a unit. Across the 7 tracked drives carrying a live in-stock price, a gigabyte runs from $0.1845/GB on the Crucial T500 2TB NVMe Gen4 SSD to $0.2437/GB on the Kingston KC3000 2048GB NVMe Gen4 SSD — 32.1% apart for storage that does the same job.
| Drive | Capacity | Price | Per GB | Per TB | Observed |
|---|---|---|---|---|---|
| Crucial T500 2TB NVMe Gen4 SSD | 2 TB | $369.00 | $0.1845/GB | $184.50/TB | Newegg · Oct 20, 2026 |
| Crucial P3 Plus 1TB NVMe Gen4 SSD | 1 TB | $187.46 | $0.1875/GB | $187.46/TB | Newegg · Oct 20, 2026 |
| WD Black SN850X 2TB NVMe Gen4 SSD | 2 TB | $374.92 | $0.1875/GB | $187.46/TB | Newegg · Oct 20, 2026 |
| Samsung 990 Pro 4TB NVMe Gen4 SSD | 4 TB | $796.50 | $0.1991/GB | $199.13/TB | Newegg · Oct 27, 2026 |
| Samsung 990 Pro 2TB NVMe Gen4 SSD | 2 TB | $408.95 | $0.2045/GB | $204.47/TB | Newegg · Oct 27, 2026 |
| SK hynix Platinum P41 2TB NVMe Gen4 SSD | 2 TB | $446.35 | $0.2232/GB | $223.18/TB | Newegg · Oct 20, 2026 |
| Kingston KC3000 2048GB NVMe Gen4 SSD | 2 TB | $499.00 | $0.2437/GB | $243.65/TB | Newegg · Oct 27, 2026 |
The median gigabyte across that basket is $0.1991/GB, or $199.13/TB, from 7 drives with current prices. That is the figure to hold onto, because it is the one every page in this SERP leaves out — and it is also the figure that makes their numbers checkable. One of the four pages publishes dated capacity ranges — a 2 TB NVMe drive at $120 to $160, as of 12 April 2026 — which sit well below anything we can observe in stock today. We are not calling it wrong: a figure dated April and a figure dated October are not the same claim, and that page names no retailer and no basket. That is the point: an undated price with no named basket cannot be compared with anything, including the price you are about to pay.
Contract prices and shelf prices are two different numbers
Nearly every percentage on this subject comes from one place: the quarterly contract-price reporting memory analysts publish for suppliers and large buyers. Those are real figures and they are not retail figures. A contract price is negotiated per bit, quarterly, in volume; a shelf price carries a retailer’s margin, inventory bought at an older cost, and whatever the listing is doing that week.
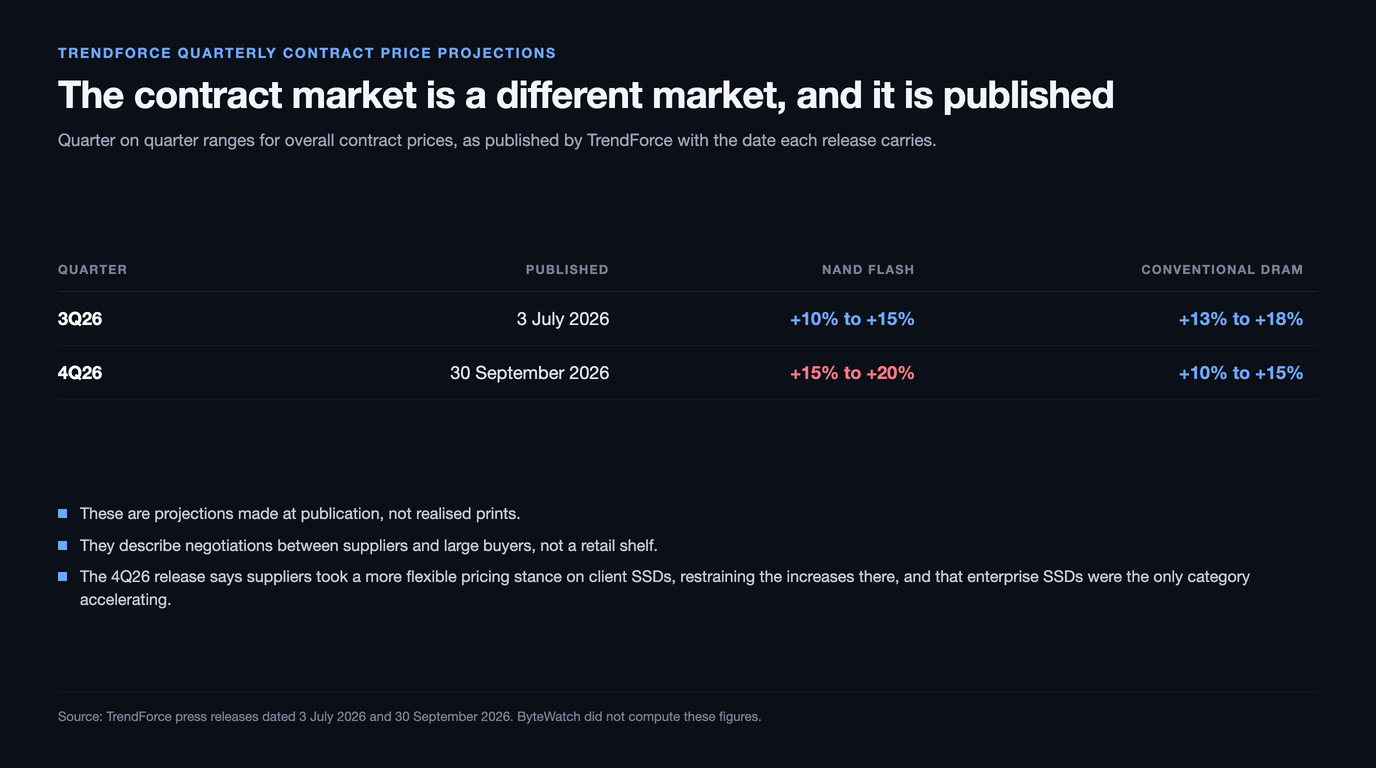
| Quarter | Published | NAND Flash QoQ | Conventional DRAM QoQ | What it says about the consumer end |
|---|---|---|---|---|
| 3Q26 | TrendForce, Jul 3, 2026 | +10–15% | +13–18% | gains moderate as consumer demand weakens and high base effects take hold; more modest increases in eMMC and UFS |
| 4Q26 | TrendForce, Sep 30, 2026 | +15–20% | +10–15% | suppliers have adopted a more flexible pricing stance on client SSDs, restraining the magnitude of price increases; enterprise SSDs are the only category to see a larger increase than the previous quarter |
Two details in that table matter more than the headline ranges. The first is that the 4Q26 release — published Sep 30, 2026, after the quarter we measured had closed — says suppliers took a more flexible pricing stance on client SSDs, restraining the increases, while enterprise SSDs were the one category accelerating. The consumer drive and the data-centre drive are not on the same curve, and a page that quotes an enterprise number to a consumer is answering a different question. The second is the direction of travel on the memory side: conventional DRAM was published at +13–18% for 3Q26 and +10–15% for 4Q26 — still rising, by less.
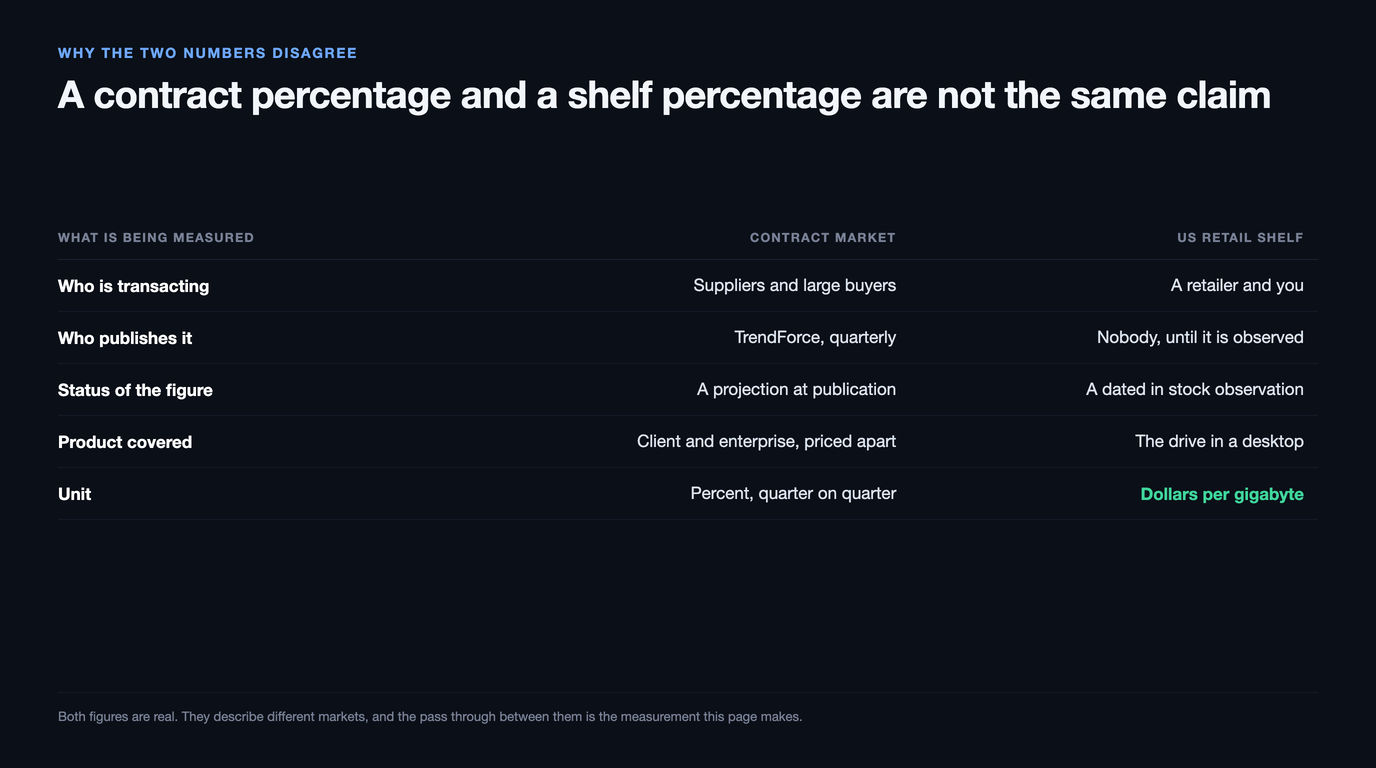
Why are SSD prices going up: how much reached the shelf
Here is the measurement no competing page makes. We have a published contract range for a quarter, and our own index over a window sitting almost entirely inside it: the median price per gigabyte across every tracked drive, normalised to 100 at the series start. Setting one against the other says how much of a contract move has shown up where a buyer meets it.
| Our index | Observed move | Window | Points | Contract range | Reached the shelf |
|---|---|---|---|---|---|
| SSD storage index | −4.4% | Aug 1, 2026 – Oct 21, 2026 · 65% of the quarter | 23 | 3Q26 +10–15% | the shelf did not rise |
| DDR5 memory index | +7.5% | Aug 1, 2026 – Aug 13, 2026 · 14% of the quarter | 4 | 3Q26 +13–18% | 42%–58% of the range |
The arithmetic is withheld whenever our index did not rise over the window, because a share of a rise that did not happen is not a number worth printing. The table says which case we are in.
Three things could produce a gap like that, and we can name them without weighing them: retailers are still selling inventory bought at an older cost, margin absorbs part of an increase before the shelf shows it, and a contract forecast is a projection rather than a print. None of that discredits either figure; they measure different things.
One listing carried most of the movement
An index is a median, and nobody buys a median. The question a reader actually has is whether the drive they want went up, and that is a different question with a different answer — sometimes the opposite answer.
| Drive | Opened | Latest | Change | Cash | Points |
|---|---|---|---|---|---|
| Kingston KC3000 2048GB NVMe Gen4 SSD | $358.65 (Aug 1) | $499.00 (Oct 27) | +39.1% | +140.35 | 9 |
| WD Black SN850X 2TB NVMe Gen4 SSD | $328.38 (Aug 1) | $374.92 (Oct 20) | +14.2% | +46.54 | 9 |
| Samsung 990 Pro 2TB NVMe Gen4 SSD | $388.55 (Jul 31) | $408.95 (Oct 27) | +5.3% | +20.40 | 44 |
| Samsung 990 Pro 4TB NVMe Gen4 SSD | $789.00 (Aug 1) | $796.50 (Oct 27) | +1.0% | +7.50 | 9 |
| SK hynix Platinum P41 2TB NVMe Gen4 SSD | $449.00 (Aug 1) | $446.35 (Oct 20) | −0.6% | −2.65 | 9 |
| Crucial T500 2TB NVMe Gen4 SSD | $389.95 (Aug 1) | $369.00 (Oct 20) | −5.4% | −20.95 | 9 |
| Crucial P3 Plus 1TB NVMe Gen4 SSD | $227.00 (Aug 1) | $187.46 (Oct 20) | −17.4% | −39.54 | 9 |
The split is stark. Kingston KC3000 2048GB NVMe Gen4 SSD moved +39.1% — $140.35 in cash — and carried 50.5% of all the cash movement in the basket across 7 drives. Remove it and the median tracked drive moved +0.2%, against +1.0% with it included. We measure that in cash rather than percent deliberately: the index is computed on prices, so a large percentage move on a cheap drive and a small one on an expensive drive are not the same event for it.
What we will not do is explain the big one. A listing repricing far outside its peers suggests a stock or availability event at that retailer rather than a market move, and we have no primary source for the drive’s status, so the page reports the observation and stops. The consequence is the useful part: one listing can move a category index several points while the drive in your basket does nothing, and a headline percentage cannot tell you which of those you are in. A watch on the drive on the live chart can.
Storage did not move like memory
The shortage is usually told as one story about memory. Our two indexes are computed identically from the same scrapes — lowest in-stock price per SKU, divided by capacity, median across the basket — which is what makes comparing them worth anything.
The two come out close — −4.4% on storage and +7.5% on DDR5 — and the caveat matters more than the closeness: they are not the same window. Our storage index runs to Oct 21, 2026 across 23 points, while the DDR5 index’s most recent point is Aug 13, 2026 across 4 — 14% of 3Q26 against storage’s 65%. Two measurements over different periods are not one comparison, so the useful reading is narrower: each side moved by single digits at retail while the contract ranges published for them that quarter were further apart than they are — +10–15% for NAND against +13–18% for conventional DRAM. Measured the same way as the storage row and over its own shorter window, the DDR5 shelf delivered 42% to 58% of its contract range.
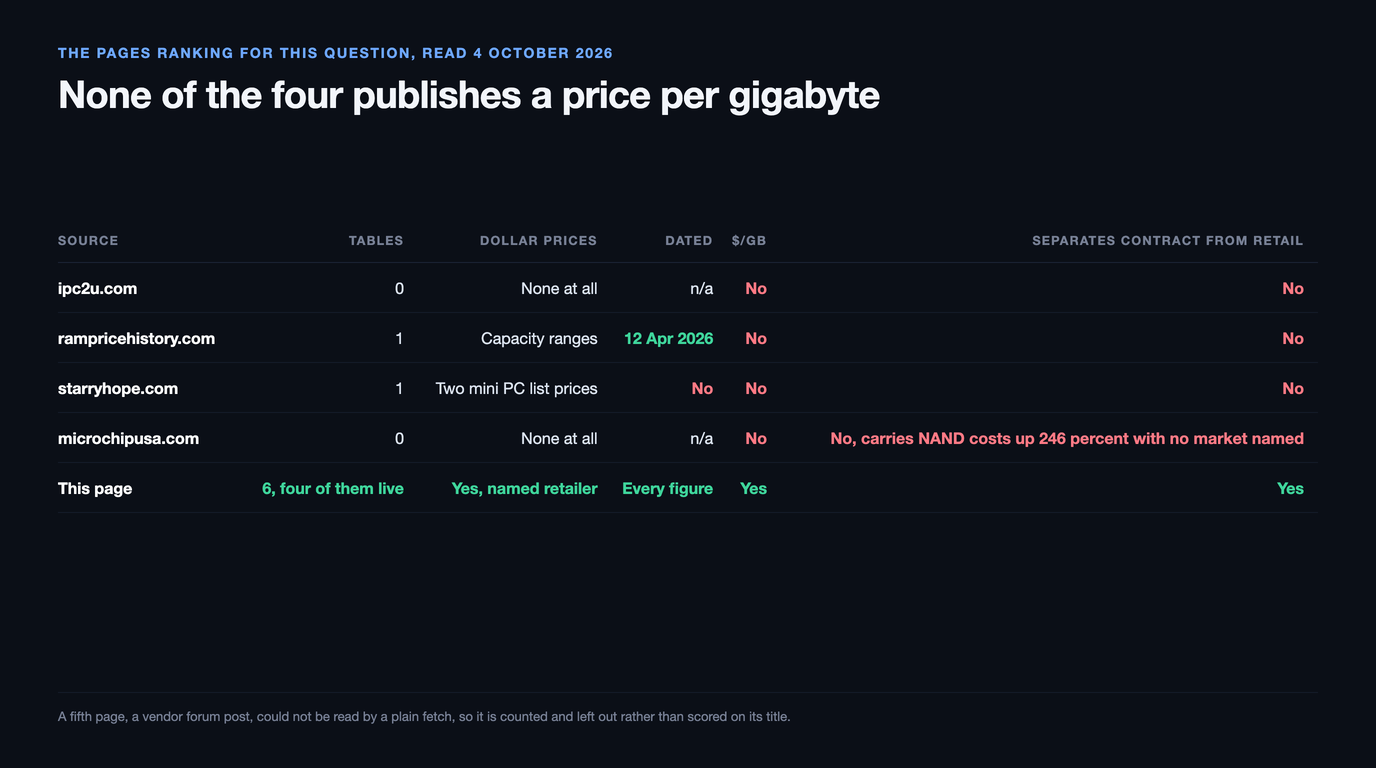
Why the published answers disagree with each other
We read the four pages ranking for this question on 4 October 2026 and scored them on what a buyer can check. A fifth, a vendor-forum post, could not be read by a plain fetch, so it is counted and left out rather than scored on its title.
| Source | Length | Tables | Dollar prices | Dated | $/GB | Separates contract from retail |
|---|---|---|---|---|---|---|
| ipc2u.com, causes and strategies | ~2,500 words | 0 | None at all | — | No | No — "up to 60%" for enterprise and industrial SSDs, contract versus retail not drawn |
| rampricehistory.com, why SSD prices went up | ~1,500 words | 1 | Yes, capacity ranges (2 TB at $120–$160) | Yes — 12 Apr 2026 | No | No |
| starryhope.com, SSD crisis buyer worksheet | ~3,500 words | 1 | Two mini-PC list prices | No | No | No |
| microchipusa.com, planning storage costs | ~1,500 words | 0 | None at all | — | No | No — carries "NAND costs up 246 percent" with no market named |
| This page | this length | 6, four of them live | Yes, named retailer | Yes, every figure | Yes | Yes — that is the measurement |
The pattern is consistent: the cause is well covered, the price is not. None publishes a price per gigabyte, two publish no dollar figure at all, and the one dated price table is six months old at reading with neither retailer nor basket named. Nor does any of them draw the contract/retail line: the largest percentage on the page — NAND costs up 246% — sits in an article about what a buyer should budget, with no market attached. All four answer the timing question with a forecast, which may turn out right and is not checkable today.
What to do about it, without a forecast
None of this says prices are not rising. It says the number you were shown came from a different market, and that the retail move sits next to a spread you can capture today without waiting for anything.
| Band | Drives | Cheapest | Dearest | Spread | Cash gap |
|---|---|---|---|---|---|
| 2 TB | 5 | Crucial T500 2TB NVMe Gen4 SSD $369.00 | Kingston KC3000 2048GB NVMe Gen4 SSD $499.00 | +35.2% | $130.00 |
That is the comparison worth carrying away. The 2 TB band runs 35.2% from cheapest to dearest right now — $130.00 on the same amount of storage — which is 8.0x the move the whole category made across our window. Picking the drive is the larger decision by a wide margin, and it needs no view on what happens next.
Price the gigabyte, not the drive. Treat an undated price as no price, including ours. Decide the capacity first, then compare inside it: the per-gigabyte curve by capacity is steeper than the brand ordering, as the 2 TB against 4 TB step shows. And watch the listing you intend to buy, because any headline percentage is a median of lines you are not buying.
How these numbers are produced
Every retail figure above is a dated in-stock observation at a tracked US retailer. Prices come from live product pages at Newegg and B&H, both of which permit it in robots.txt and robots.txt — we record that check before a retailer’s first scrape, and Amazon is only ever reached through the Keepa API.
An out-of-stock listing records no price rather than carrying the last one forward, and a move over 60% waits for a second scrape, so a retailer glitch cannot appear here as a market event. A basket median needs five drives, a capacity band three, a per-drive move four observations; nothing older than 30 days is shown as current. Demo rows are blocked at the database layer rather than by convention, so a fabricated price cannot reach this article.
Related reading
FAQ
Why are SSD prices going up in 2026?
Because the contract market that supplies the NAND repriced, and some of that has reached retail. TrendForce published overall NAND Flash contract prices at +10–15% QoQ for 3Q26 and +15–20% for 4Q26, with AI server demand as the driver. The part almost nobody publishes is how much of it arrives on a shelf: our storage index, from dated in-stock US retail observations, moved by a different amount over a window covering most of the same quarter. Both figures are real; they are different markets.
How much have SSD prices actually risen at retail?
On our basket, by a different amount than the contract headlines, and very unevenly. The live table here prints the index move with its own window and point count, and the per-drive table shows the spread behind it: on recent windows a single listing has carried most of the basket’s cash movement while the median drive moved a few percent. An index is a median, and nobody buys a median.
Will SSD prices come back down in 2026?
We do not know, and we will not publish a guess. ByteWatch does not forecast prices: every figure here is a dated observation, and any page that answers this is answering with a prediction. What we can tell you is what has already happened on each drive we track and what spread sits on the shelf today — both checkable, and neither needs you to wait.
Is now a good time to buy an SSD?
That depends on a price nobody has observed yet, so instead here is the part you can act on. The cheapest-to-dearest spread inside one capacity band on our basket has recently been many times larger than the whole category’s move across our window — so which drive you pick has mattered more than which week you bought. Compare per gigabyte inside the capacity you need, and check the date on every figure.
Are SSD prices rising as fast as RAM prices?
Not as separately as the reporting implies. Our two indexes are computed identically from the same scrapes, and over the current window they have moved close to each other — while the published contract ranges for NAND and conventional DRAM that quarter were several points apart. The levels are nothing alike: a gigabyte of DDR5 costs tens of times a gigabyte of NVMe flash, so the same percentage costs a budget far more on the memory side.
Does the NAND shortage hit consumer drives or data-centre drives harder?
TrendForce’s 4Q26 release, published Sep 30, 2026, says enterprise SSDs were the only memory category to see a larger increase than in the previous quarter, while suppliers took a more flexible pricing stance on client SSDs that restrained the increases there. So a figure quoted for enterprise storage is not an answer about the drive in a desktop.
Why do different sites publish such different SSD prices?
Mostly because they state no basket and no date. One page ranking for this question lists a 2 TB NVMe drive at $120–$160 as of 12 April 2026 with no retailer named, and our lowest dated in-stock observations today sit well above that. Neither has to be wrong for both to be useless to each other: a marketplace listing, a mainstream Gen4 drive at a US retailer and an OEM contract price are three different numbers. Ours names the retailer, the capacity, the interface and the day.
What is a good price per gigabyte for an NVMe SSD right now?
Our tracked median is $0.1991 per gigabyte across 7 drives with current in-stock prices, with the cheapest at $0.1845 and the dearest at $0.2437. Use the cheapest column as your target and the median as a sanity check: anything far above it at the same capacity and interface is paying for something that is not storage.
Watch the listing, not the headline
We track NVMe, DDR5 and DDR4 listings at US retailers and tell you when one of yours moves past your threshold. No forecasts, no deal scores, no affiliate links, no commission on anything you buy — observed prices, dated, with the sample size printed next to them.
Context: NVMe Gen4 from $0.184/GB, DDR5 from $16.53/GB, cheapest in-stock observations in the last 30 days.